Hôm nay mình đọc trên medium có thấy một bài rất hay, bài viết có nêu một từ mới đối với mình, là Metaverse. Mình khá hứng thú với bài viết nên cũng đăng bài này nhằm mục đích chia sẻ quan điểm của mình.
Khi nào sẽ xuất hiện Metaverse?
Trước khi đề cập đến khái niệm này mình muốn chỉ ra là chúng ta đang nói đến một thứ thuộc về tương lai. Hiện tại trình độ khoa học công nghệ của chúng ta chưa đủ để tạo ra một metaverse hoàn chỉnh. Nhưng không có nghĩa là trong tương lại sẽ không có, bài viết này mình sẽ miêu tả về một cách sử dụng internet khác hoàn toàn cách chúng ta sử dụng hiện tại. Nhưng trước tiên, mời các bạn cùng mình điểm qua các thế hệ đang dùng internet ngày nay.
Những ai đang sử dụng Internet năm 2021?
Để bắt đầu bài viết mình xin liệt kê một số thế hệ được sinh ra vào các năm như sau:
GenerationX
1965 đến 1980
GenerationY
1981 đến 1994
GenerationZ
1997 đến năm 2012
GenerationA
2012 đến năm 2025
Có sự khác biệt về những thế hệ trên, nhưng ở đây mình chỉ xét về yếu tố công nghệ và tiếp xúc với công nghệ, internet, facebook, AI, blockchain…
Nhìn từ trên xuống thì GenX, chính là cha mẹ chúng ta, hầu như tiếp xúc với IT vào những năm cuối đời, nên đối với họ công nghệ chỉ là công cụ hỗ trợ. Nhiều người không tin công nghệ thông tin có thể làm được nhiều.
GenY, là tác giả(1991): là thế hệ tiên phong trong việc tiếp cận công nghệ, internet, cloud, iphone, ipod, AI, gần nhất là blockchain. Có thể nói chúng ta may mắn sinh ra trong một thời kì bùng nổ mạnh mẽ của internet và chúng ta nhìn thấy internet lớn lên cùng mình. Mình vẫn nhớ ngày đầu tiên dùng Internet Explorer hay Facebook, giờ nhớ lại nhìn như 1 trang web trẻ con mà bây giờ ai cũng làm được.
Chúng ta là thế hệ tiên phong, có kỷ niệm về những ngày đầu của thế giới số, thành tựu của chúng ta có thể kể tới Yahoo, Facebook, Google, Amazon, Youtube. Những cá nhân tiêu biểu như Mark Zukerberg, Jeff bezos….
GenZ(1997): Thế hệ này gần như được tiếp xúc với công nghệ thông tin từ khi họ sinh ra, đăc biệt là sau 2007, khi iphone thống trị thế giới di động. Họ hiện nay là thế hệ trẻ nhất, thành phần nòng cốt của thế giới công nghệ. Và đây cũng là thế hệ, mà theo ý kiến tác giả, là họ quen thuộc với thế giới thứ 2, thế giới ảo, bao gồm Facebook, Instagram, snapchat…
Đây là thế hệ gần với thế hệ Y, họ kế thừa và phát triển những công nghệ có sẵn. Những sản phẩm thay đổi thế giới xuất hiện trong giai đoạn này gồm có: XR(AR và VR), công nghệ thưc thế tăng cường, cho phép chúng ta nhìn thấy và làm việc với môi trường 3D. Snapchat, Tiktok, instagram. Những Influencer xuất hiện nhiều hơn nhờ tương tác tốt trên nền tảng mạng xã hội….
Gen A(???): Thế hệ này đến khi viết bài viết này thì các cháu lớn nhất là 9 tuổi, chính là thế hệ tương lai của chúng ta. Mặc dù chưa có định hình rõ về GenA nhưng chúng ta thấy những bé này sinh được tiếp xúc từ nhỏ với những gì ta thấy cao siêu, mới mẻ, những đối với chúng thì đó là chuyện bình thường. Những đứa trẻ GenA này sẽ lớn lên cùng robot, AI, dùng tiền điện tử để thanh toán. Mua bán trực tuyến…. Và, đặc biệt hơn, có thể thế hệ này của chúng ta sẽ không chỉ sống trong 1 thế giới chúng ta đang sống, mà còn sống trong 1 thế giới khác –> Metaverse?
Vậy thì quay lại với tiêu đề bài viết, Metaverse là gì? Theo định nghĩa:
Metaverse là thế giới kỹ thuật số, nơi mà bất cứ thứ gì chúng ta có thể tưởng tượng đều có thể tồn tại. Cuối cùng, chúng ta sẽ luôn được kết nối với metaverse, mở rộng các giác quan về thị giác, âm thanh và xúc giác, kết hợp các vật phẩm kỹ thuật số vào thế giới thực hoặc thả mình vào môi trường 3D hoàn toàn nhập vai bất cứ khi nào chúng ta muốn. Họ công nghệ đó được gọi chung là eXtended Reality (XR).
Metaverse?
Khái niệm này mới nghe qua có vẻ xa vời, nhưng thực ra nó đã có từ khá lâu. Các bạn 8x 9x chắc không xa lạ gì với các game nhập vai như diablo, MU hay kinh điển là võ lâm truyền kì:))
Đây là những game mà đề cập tới khái niệm Avatar(là nhân vật của các bạn). Nghĩa là sáng các bạn sống cuộc đời của mình, đi làm đi học, tối về các bạn sống cuộc sống của một vị đại hiệp đi trừ gian diệt bạo. Và phải bỏ tiền mua vật phẩm trong game, hoặc đi săn boss… Nhưng tất nhiên là game chỉ bó hẹp trong tiểu thuyết võ hiệp thôi, Hãy tưởng tượng 1 game tương tự như Võ Lâm, nhưng cho phép người chơi tùy sức sáng tạo ra các thế giới mới, các loại võ công mới, không những vậy nó không chỉ gói gọi trong game kiếm hiệp nữa, mà là tất cả những gì bạn có thể tưởng tượng, tổng hợp lại trong 1 thế giới duy nhất gọi là Metaverse.
Nguồn gốc & đặc điểm của Metaverse
Liệu Metaverse có phải là một thuật ngữ mới nổi lên trong thời đại công nghệ thông tin phát triển như ngày hôm nay?
Sự thật là, “Metaverse” đã được đề cập lần đầu tiên trong cuốn tiểu thuyết khoa học viễn tưởng “Snow Crash” của Neal Stephenson vào năm 1992, được mô tả là một nơi con người có thể tương tác qua lại với nhau thông qua không gian ông gọi là cyberpunk.
Như vậy, thuật ngữ “Metaverse” đã được ra đời từ cách đây khá lâu (trước cả thời đại Internet). Bản thân từ Metaverse cũng được cấu tạo từ 2 từ đó là Meta (beyond hay là vượt lên) và Verse (trong universe hay vũ trụ). Do đó concept này có hàm ý “vượt lên vũ trụ hiện hữu”.
Một số đặc điểm của Metaverse có thể kể đến đó là:
Sustainability: Khả năng duy trì và liên tục có những cải tiến về dịch vụ hay hệ sinh thái trong đó.
Immersion: Mức độ chân thực của Metaverse (đặc điểm này trả lời cho câu hỏi liệu trải nghiệm của chúng ta trong Metaverse đạt được bao nhiêu % so với thực tế).
Openness: Tính mở, có nghĩa là Metaverse cho phép người tham gia có thể kết nối hoặc ngắt kết nối bất kỳ lúc nào. Đồng thời đó phải là không gian mở cho phép những sáng tạo trở nên không có giới hạn.
Economic System: Một hệ thống kinh tế song song với thực tế. Trong đó, người tham gia có thể dịch chuyển tài sản của mình giữa thế giới thực và Metaverse một cách dễ dàng, cũng như có thể dựa trên việc có những cải tiến sáng tạo đột phá trong metaverse để tích luỹ và gia tăng tài sản cho chính bản thân.
Các ông lớn công nghệ nói gì về metaverse
Không phải ngẫu nhiên Metaverse có tiềm năng to lớn như thế. Ngoài việc giải quyết những nhu cầu trong thực tiễn đời sống thì nó còn phải thu hút được sự chú ý từ những ông lớn – những tổ chức có những nguồn lực dồi dào thì mới hiện thực hoá được tầm nhìn khổng lồ như trên.
Cái tên đầu tiên có thể kể tới đó là Mark Zuckerberg – Founder & CEO của Facebook.
Chia sẻ về metaverse, Mark cho rằng:
“Internet di động ngày nay đã có thể đáp ứng nhiều nhu cầu khác nhau của mọi người từ lúc thức dậy đến khi đi ngủ. Vì vậy, tôi không nghĩ mục đích chính của Metaverse là để mọi người tham gia vào Internet nhiều hơn, mà là cho phép mọi người tham gia vào Internet một cách tự nhiên hơn”.
Đi cùng với đó là những động thái trong việc phát triển Metaverse, Facebook cũng đã đầu tư các thiết bị VR thông qua việc sở hữu Oculus để sẵn sàng hoàn thành những cơ sở hạ tầng phần cứng thiết yếu cho Metaverse vào những năm cuối của thập kỷ.
Ngoài Facebook, các gã khổng lồ công nghệ như Google, Microsoft, Sony cũng đã cùng Facebook thành lập nên XR Association – một liên minh với tham vọng tạo nên tương lai của “Experiential Reality”.
Tất nhiên, để tránh trường hợp như các phim viễn tưởng, thế giới nào cũng bị 1 tên độc tài thao túng, các tổ chức đề cao về tính phi tập trung của Metaverse, cho rằng tính decentralized phải được đề cao để người dùng thỏa sức sáng tạo và có quyền thực sự sở hữu những thứ họ có được trong metaverse.
Nếu đề cao tính phi tập trung, phải chăng Blockchain là nơi lý tưởng để phát triển Metaverse?
Trên thực tế, Metaverse có thể được thiết lập trên nền của rất nhiều lại công nghệ khác nhau. Tuy nhiên, trong một thế giới đề cao sự sáng tạo không giới hạn, tương tác, tính tự do phân quyền như Metaverse thì dường như Blockchain sẽ là một trong những công nghệ then chốt của thế giới này.
Tại sao lại như vậy?
Thứ nhất: ngành công nghiệp Metaverse đang có sự tham gia của rất nhiều công ty công nghệ, bao gồm cả phần cứng, lẫn phần mềm, blockchain, gaming, …
Một vấn đề có thể thấy rõ ràng trong các các nền tảng đã tồn tại này đó là chúng gần như không có khả năng tương tác với nhau. Anh em không thể di chuyển hoặc trao đổi một vật phẩm rất hiếm trong Fortnite để lấy một vật phẩm tương đương trong Minecraft được.
Ngoài ra, những vật phẩm trong game mà người chơi đang sở hữu cũng không thực sự thuộc về các bạn trong các tựa game này, điều này khiến cho tính cá nhân hoá & tính sở hữu không được đề cao. Và đôi khi chỉ cần một vài yếu tố ví dụ như luật pháp hoặc chính sách công ty tác động thì các vật phẩm này có thể biến mất khỏi tài khoản của bạn.
Và tất cả các bài toán kể trên có thể được giải quyết trên công nghệ Blockchain:
Nguồn: coin98:
Xét về khả năng mở rộng : Các Blockchain hiện tại cho khả năng mở rộng rất lớn. Đặc biệt đối với Blockchain có concept dạng Internet of Blockchain như Avalanche, Polkadot hay Cosmos.
Xét về khả năng tương tác : Tài sản trên các Blockchain khác nhau hoàn toàn có thể dịch chuyển qua lại thông qua công nghệ Cross-chain.
Xét về tính cá nhân hoá : Điều này được biểu hiện rõ nhất thông qua NFTs– các token độc nhất và không thể được thay thế.
Xét về tính bảo mật: Công nghệ Blockchain với tính bảo mật cao sẽ giúp tài sản trong không gian mạng của anh em tránh khỏi những đợt tấn công từ Hackers.
Dự đoán về Metaverse
Hiện tại Vẫn là một concept thuộc về tương lai
Tuy công nghệ thông tin đã và đang phát triển rất mạnh mẽ, nhưng hiện tại Metaverse vẫn chỉ là một concept thuộc về tương lai, và đây chưa phải là thời điểm để bùng nổ. Nhưng không có gì là không thể.
Bằng chứng đầu tiên nằm ở việc chúng ta có thể thấy hiện nay, các công cụ VR còn đang rất hạn chế và khá đắt đỏ trên thị trường. Đồng thời, các trải nghiệm hỗ trợ VR vẫn chưa phổ biến, cũng như các nhà phát triển cũng chưa mặn mà với việc phát triển VR do thị trường chưa thực sự lớn.
Số liệu về Market Size của công nghệ Virtual Reality Market trong năm 2021 ước tính đạt khoảng $22B (theo Grand View Research) – vẫn là một con số rất nhỏ so với tiềm năng khổng lồ mà Metaverse có thể đạt được
Cũng theo đơn vị này ước tính rằng, tốc độ tăng trưởng kép của VR Industry sẽ rơi vào khoảng 18%/năm và đạt $70B vào năm 2028.
FORTNITE-game có nhiều sự tương đồng với metaverse
VR hardware là yếu tố then chốt và là nền tảng để có được Metaverse thực sự. Tuy nhiên, không phải khi VR phát triển xong thì Content Layer mới phát triển mà nó sẽ phát triển song hành và đợi thời điểm VR Hardware đạt đến độ chín mùi để có thể bùng nổ.
Bằng chứng đó chính là sự tham gia của rất nhiều các ông lớn công nghệ với tầm nhìn xây dựng nên Metaverse trong bối cảnh dịch bệnh hiện tại:
Facebook công bố tham gia vào Metaverse Industry.
Với tầm nhìn xây dựng Metaverse, Epic games – công ty đứng sau tựa game Fortnite đã huy động $1B nâng giá trị công ty lên $30B.
Trong tháng 6, Matthew Ball, một nhà đầu tư mạo hiểm đã thúc đẩy thành lập một quỹ ETF bao gồm các công ty hoạt động trong lĩnh vực Metaverse (phần cứng và phần mềm) như NVIDIA hay Roblox.
…
Tóm lại, Metaverse là một ngành công nghiệp đầy hứa hẹn trong tương lai. Cùng với sự tham gia đầu tư mạnh tay đến từ các ông lớn công nghệ thì một thế giới ảo song song với thực tại sẽ là một tương lai không xa.
Lần này mình sẽ tóm tắt về các video Amazon Web Services. Mình đã làm 1 kênh youtube về DevOps cũng như Amazon Web Services để tổng hợp những kiến thức cơ bản về Infrastructure as a Services.
Sau đây mình sẽ tổng hợp một số video nổi bật:
AWS series 1: Đây là phần video đầu miêu tả cơ bản về cách mà 1 web-services hoạt động, gồm front-end, back-end, cơ sở dữ liệu (database), và cách chúng giao tiếp với nhau.
AWS series 2: Tiếp theo mình sẽ đi sâu hơn về cách lữu trữ dữ liệu, cache, Bussiness Intelligent, các mô-dul của backend như là Click stream Analysis phân tích số click chuột của khách hàng.
AWS series 3: Phần này là giới thiệu khái niệm là chính, cũng chính là các micro services ở trên nhưng mình giới thiệu tên của chúng trong Amazon Web Services(AWS)
AWS series 4: Tiếp theo của phần 3, giới thiệu cho các bạn full cây về AWS micro services và cách chúng kết hợp để cấu thành, vận hành, bảo trì và quản lý một website.
AWS series 5: Tổng kết lại những gì chúng ta đã học và giới thiệu cách deploy services từ Cloud Formation template, hoặc Infrastructure as Code như terraform.
Đây là những gì mình tổng kết và thấy hay cho các bạn làm DevOps hoặc Cloud Engineer, đặc biệt là những bạn mới vào nghề hoặc đang thực hành vọc AWS, Azure, GCP. Nếu thấy hay nhớ like và Subcribe cho mình nhé.
In Big Data, an enormous volume of data is used. Regarding data, we have two main challenges.The first challenge is how to collect large volume of data and the second challenge is to analyze the collected data. To overcome those challenges, you must need a messaging system.
Kafka is designed for distributed high throughput systems. Kafka tends to work very well as a replacement for a more traditional message broker. In comparison to other messaging systems, Kafka has better throughput, built-in partitioning, replication and inherent fault-tolerance, which makes it a good fit for large-scale message processing applications.
Trong BigData, một khối lượng dữ liệu khổng lồ được sử dụng. Về dữ liệu, chúng ta có hai thách thức chính, thách thức đầu tiên là làm thế nào để thu thập khối lượng lớn dữ liệu và thách thức thứ hai là phân tích dữ liệu thu thập được. Để vượt qua những thách thức đó, bạn phải cần một hệ thống nhắn tin.
Kafka được thiết kế cho các hệ thống thông lượng cao phân tán. Kafka có xu hướng hoạt động rất hiệu quả khi thay thế cho một nhà môi giới tin nhắn truyền thống hơn. So với các hệ thống nhắn tin khác, Kafka có thông lượng tốt hơn, phân vùng tích hợp, sao chép và khả năng chịu lỗi vốn có, điều này làm cho nó phù hợp với các ứng dụng xử lý tin nhắn quy mô lớn.
Translate to Vietnamese
What is a Messaging System?
A Messaging System is responsible for transferring data from one application to another, so the applications can focus on data, but not worry about how to share it. Distributed messaging is based on the concept of reliable message queuing. Messages are queued asynchronously between client applications and messaging system. Two types of messaging patterns are available − one is point to point and the other is publish-subscribe (pub-sub) messaging system. Most of the messaging patterns follow pub-sub.
Hệ thống Nhắn tin chịu trách nhiệm chuyển dữ liệu từ ứng dụng này sang ứng dụng khác, vì vậy các ứng dụng có thể tập trung vào dữ liệu, nhưng không phải lo lắng về cách chia sẻ dữ liệu đó. Nhắn tin phân tán dựa trên khái niệm xếp hàng tin nhắn đáng tin cậy. Tin nhắn được xếp hàng đợi không đồng bộ giữa các ứng dụng khách và hệ thống nhắn tin. Có hai kiểu nhắn tin – một kiểu là trỏ tới điểm và kiểu kia là hệ thống nhắn tin đăng ký xuất bản (pub-sub). Hầu hết các kiểu nhắn tin đều tuân theo pub-sub.
Translate to Vietnamese
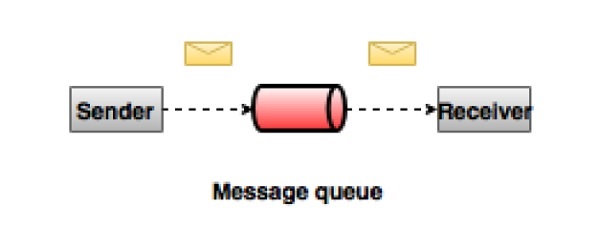
Point to Point Messaging System
In a point-to-point system, messages are persisted in a queue. One or more consumers can consume the messages in the queue, but a particular message can be consumed by a maximum of one consumer only. Once a consumer reads a message in the queue, it disappears from that queue. The typical example of this system is an Order Processing System, where each order will be processed by one Order Processor, but Multiple Order Processors can work as well at the same time. The following diagram depicts the structure.
Trong point to point system, các thông báo được lưu trong một hàng đợi. Một hoặc nhiều người tiêu dùng có thể sử dụng các tin nhắn trong hàng đợi, nhưng một tin nhắn cụ thể chỉ có thể được sử dụng bởi tối đa một người tiêu dùng. Khi người tiêu dùng đọc một tin nhắn trong hàng đợi, tin nhắn đó sẽ biến mất khỏi hàng đợi đó. Ví dụ điển hình của hệ thống này là Hệ thống xử lý đơn hàng, trong đó mỗi đơn hàng sẽ được xử lý bởi một Bộ xử lý đơn hàng, nhưng Nhiều Bộ xử lý đơn hàng cũng có thể hoạt động cùng một lúc. Sơ đồ sau đây mô tả cấu trúc.
Translate to Vietnamese
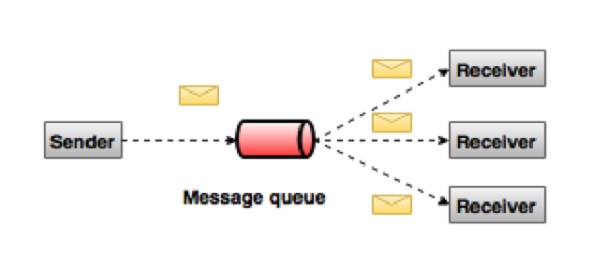
Publish-Subscribe Messaging System
In the publish-subscribe system, messages are persisted in a topic. Unlike point-to-point system, consumers can subscribe to one or more topic and consume all the messages in that topic. In the Publish-Subscribe system, message producers are called publishers and message consumers are called subscribers. A real-life example is Dish TV, which publishes different channels like sports, movies, music, etc., and anyone can subscribe to their own set of channels and get them whenever their subscribed channels are available.
What is Kafka?
Apache Kafka is a distributed publish-subscribe messaging system and a robust queue that can handle a high volume of data and enables you to pass messages from one end-point to another. Kafka is suitable for both offline and online message consumption. Kafka messages are persisted on the disk and replicated within the cluster to prevent data loss. Kafka is built on top of the ZooKeeper synchronization service. It integrates very well with Apache Storm and Spark for real-time streaming data analysis.
Benefits
Following are a few benefits of Kafka −
Reliability − Kafka is distributed, partitioned, replicated and fault tolerance.
Scalability − Kafka messaging system scales easily without down time..
Durability − Kafka uses Distributed commit log which means messages persists on disk as fast as possible, hence it is durable..
Performance − Kafka has high throughput for both publishing and subscribing messages. It maintains stable performance even many TB of messages are stored.
Kafka is very fast and guarantees zero downtime and zero data loss.
Use Cases
Kafka can be used in many Use Cases. Some of them are listed below −
Metrics − Kafka is often used for operational monitoring data. This involves aggregating statistics from distributed applications to produce centralized feeds of operational data.
Log Aggregation Solution − Kafka can be used across an organization to collect logs from multiple services and make them available in a standard format to multiple con-sumers.
Stream Processing − Popular frameworks such as Storm and Spark Streaming read data from a topic, processes it, and write processed data to a new topic where it becomes available for users and applications. Kafka’s strong durability is also very useful in the context of stream processing.
Need for Kafka
Kafka is a unified platform for handling all the real-time data feeds. Kafka supports low latency message delivery and gives guarantee for fault tolerance in the presence of machine failures. It has the ability to handle a large number of diverse consumers. Kafka is very fast, performs 2 million writes/sec. Kafka persists all data to the disk, which essentially means that all the writes go to the page cache of the OS (RAM). This makes it very efficient to transfer data from page cache to a network socket.
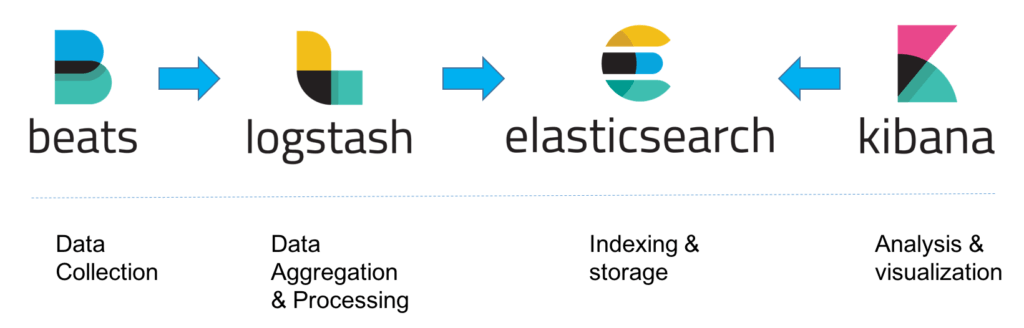
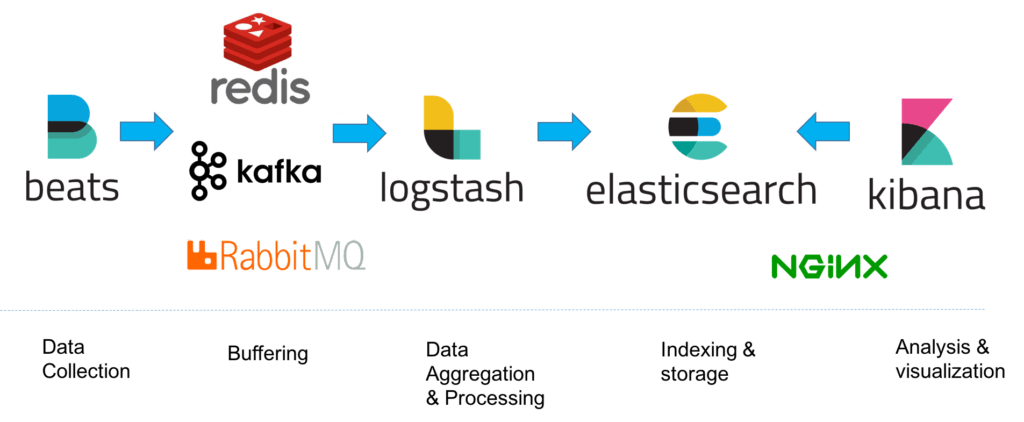
Up until a year or two ago, the ELK Stack was a collection of three open-source products — Elasticsearch, Logstash, and Kibana — all developed, managed and maintained by Elastic. The introduction and subsequent addition of Beats turned the stack into a four legged project and led to a renaming of the stack as the Elastic Stack.
Elasticsearch is an open source, full-text search and analysis engine, based on the Apache Lucene search engine. Logstash is a log aggregator that collects data from various input sources, executes different transformations and enhancements and then ships the data to various supported output destinations. Kibana is a visualization layer that works on top of Elasticsearch, providing users with the ability to analyze and visualize the data. And last but not least — Beats are lightweight agents that are installed on edge hosts to collect different types of data for forwarding into the stack.
Together, these different components are most commonly used for monitoring, troubleshooting and securing IT environments (though there are many more use cases for the ELK Stack such as business intelligence and web analytics). Beats and Logstash take care of data collection and processing, Elasticsearch indexes and stores the data, and Kibana provides a user interface for querying the data and visualizing it.
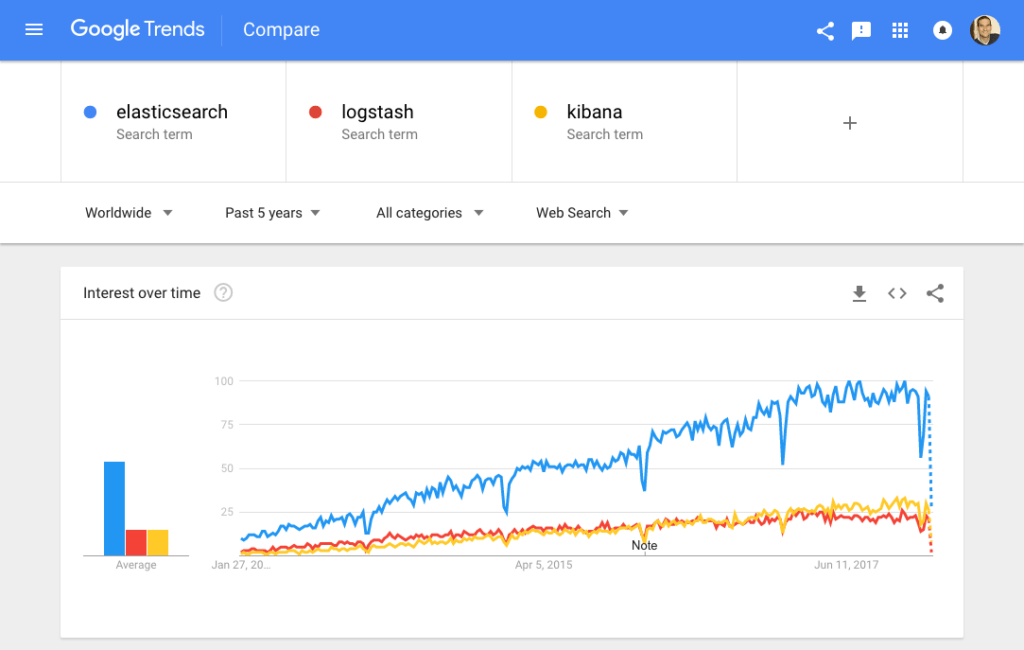
Why is ELK So Popular?
The ELK Stack is popular because it fulfills a need in the log management and analytics space. Monitoring modern applications and the IT infrastructure they are deployed on requires a log management and analytics solution that enables engineers to overcome the challenge of monitoring what are highly distributed, dynamic and noisy environments.
The ELK Stack helps by providing users with a powerful platform that collects and processes data from multiple data sources, stores that data in one centralized data store that can scale as data grows, and that provides a set of tools to analyze the data.
Of course, the ELK Stack is open source. With IT organizations favoring open source products, this alone could explain the popularity of the stack. Using open source means organizations can avoid vendor lock-in and onboard new talent much more easily. Everyone knows how to use Kibana, right? Open source also means a vibrant community constantly driving new features and innovation and helping out in case of need.
Sure, Splunk has long been a market leader in the space. But its numerous functionalities are increasingly not worth the expensive price — especially for smaller companies such as SaaS products and tech startups. Splunk has about 15,000 customers while ELK is downloaded more times in a single month than Splunk’s total customer count — and many times over at that. ELK might not have all of the features of Splunk, but it does not need those analytical bells and whistles. ELK is a simple but robust log management and analytics platform that costs a fraction of the price.
Why is Log Analysis Becoming More Important?
In today’s competitive world, organizations cannot afford one second of downtime or slow performance of their applications. Performance issues can damage a brand and in some cases translate into a direct revenue loss. For the same reason, organizations cannot afford to be compromised as well, and not complying with regulatory standards can result in hefty fines and damage a business just as much as a performance issue.
To ensure apps are available, performant and secure at all times, engineers rely on the different types of data generated by their applications and the infrastructure supporting them. This data, whether event logs or metrics, or both, enables monitoring of these systems and the identification and resolution of issues should they occur.
Logs have always existed and so have the different tools available for analyzing them. What has changed, though, is the underlying architecture of the environments generating these logs. Architecture has evolved into microservices, containers and orchestration infrastructure deployed on the cloud, across clouds or in hybrid environments. Not only that, the sheer volume of data generated by these environments is constantly growing and constitutes a challenge in itself. Long gone are the days when an engineer could simply SSH into a machine and grep a log file. This cannot be done in environments consisting of hundreds of containers generating TBs of log data a day.
This is where centralized log management and analytics solutions such as the ELK Stack come into the picture, allowing engineers, whether DevOps, IT Operations or SREs, to gain the visibility they need and ensure apps are available and performant at all times.
Modern log management and analysis solutions include the following key capabilities:
Aggregation – the ability to collect and ship logs from multiple data sources.
Processing – the ability to transform log messages into meaningful data for easier analysis.
Storage – the ability to store data for extended time periods to allow for monitoring, trend analysis, and security use cases.
Analysis – the ability to dissect the data by querying it and creating visualizations and dashboards on top of it.
How to Use the ELK Stack for Log Analysis
As I mentioned above, taken together, the different components of the ELK Stack provide a simple yet powerful solution for log management and analytics.
The various components in the ELK Stack were designed to interact and play nicely with each other without too much extra configuration. However, how you end up designing the stack greatly differs on your environment and use case.
For a small-sized development environment, the classic architecture will look as follows:
However, for handling more complex pipelines built for handling large amounts of data in production, additional components are likely to be added into your logging architecture, for resiliency (Kafka, RabbitMQ, Redis) and security (nginx):
This is of course a simplified diagram for the sake of illustration. A full production-grade architecture will consist of multiple Elasticsearch nodes, perhaps multiple Logstash instances, an archiving mechanism, an alerting plugin and a full replication across regions or segments of your data center for high availability. You can read a full description of what it takes to deploy ELK as a production-grade log management and analytics solution in the relevant section below.
WHAT’S NEW?
As one might expect from an extremely popular open source project, the ELK Stack is constantly and frequently updated with new features. Keeping abreast of these changes is challenging, so in this section we’ll provide a highlight of the new features introduced in major releases.
Elasticsearch
Elasticsearch 7.x is much easier to setup since it now ships with Java bundled. Performance improvements include a real memory circuit breaker, improved search performance and a 1-shard policy. In addition, a new cluster coordination layer makes Elasticsearch more scalable and resilient.
Logstash
Logstash’s Java execution engine (announced as experimental in version 6.3) is enabled by default in version 7.x. Replacing the old Ruby execution engine, it boasts better performance, reduced memory usage and overall — an entirely faster experience.
Kibana
Kibana is undergoing some major facelifting with new pages and usability improvements. The latest release includes a dark mode, improved querying and filtering and improvements to Canvas.
Beats
Beats 7.x conform with the new Elastic Common Schema (ECS) — a new standard for field formatting. Metricbeat supports a new AWS module for pulling data from Amazon CloudWatch, Kinesis and SQS. New modules were introduced in Filebeat and Auditbeat as well.
For a full detailed breakdown of the new features available in version 7.x, see this blog post.
INSTALLING ELK
The ELK Stack can be installed using a variety of methods and on a wide array of different operating systems and environments. ELK can be installed locally, on the cloud, using Docker and configuration management systems like Ansible, Puppet, and Chef. The stack can be installed using a tarball or .zip packages or from repositories.
Many of the installation steps are similar from environment to environment and since we cannot cover all the different scenarios, we will provide an example for installing all the components of the stack — Elasticsearch, Logstash, Kibana, and Beats — on Linux. Links to other installation guides can be found below.
Environment specifications
To perform the steps below, we set up a single AWS Ubuntu 18.04 machine on an m4.large instance using its local storage. We started an EC2 instance in the public subnet of a VPC, and then we set up the security group (firewall) to enable access from anywhere using SSH and TCP 5601 (Kibana). Finally, we added a new elastic IP address and associated it with our running instance in order to connect to the internet.
Please note that the version we installed here is 6.2. Changes have been made in more recent versions to the licensing model, including the inclusion of basic X-Pack features into the default installation packages.
Installing Elasticsearch
First, you need to add Elastic’s signing key so that the downloaded package can be verified (skip this step if you’ve already installed packages from Elastic):
Elasticsearch configurations are done using a configuration file that allows you to configure general settings (e.g. node name), as well as network settings (e.g. host and port), where data is stored, memory, log files, and more.
For our example, since we are installing Elasticsearch on AWS, it is a good best practice to bind Elasticsearch to either a private IP or localhost:
sudo vim /etc/elasticsearch/elasticsearch.yml

network.host: "localhost"
http.port:9200
cluster.initial_master_nodes: ["<PrivateIP"]
Copy
To run Elasticsearch, use:
sudo service elasticsearch start
Copy
To confirm that everything is working as expected, point curl or your browser to http://localhost:9200, and you should see something like the following output:
These specific configurations tell Kibana which Elasticsearch to connect to and which port to use.
Now, start Kibana with:
sudo service kibana start
Copy
Open up Kibana in your browser with: http://localhost:5601. You will be presented with the Kibana home page.
Installing Beats
The various shippers belonging to the Beats family can be installed in exactly the same way as we installed the other components.
As an example, let’s install Metricbeat:
sudo apt-get install metricbeat
Copy
To start Metricbeat, enter:
sudo service metricbeat start
Copy
Metricbeat will begin monitoring your server and create an Elasticsearch index which you can define in Kibana. In the next step, however, we will describe how to set up a data pipeline using Logstash.
For the purpose of this tutorial, we’ve prepared some sample data containing Apache access logs that is refreshed daily. You can download the data here: sample-data
Next, create a new Logstash configuration file at: /etc/logstash/conf.d/apache-01.conf:
sudo vim /etc/logstash/conf.d/apache-01.conf
Copy
Enter the following Logstash configuration (change the path to the file you downloaded accordingly):
If all goes well, a new Logstash index will be created in Elasticsearch, the pattern of which can now be defined in Kibana.
In Kibana, go to Management → Kibana Index Patterns. Kibana should display the Logstash index and along with the Metricbeat index if you followed the steps for installing and running Metricbeat).
Enter “logstash-*” as the index pattern, and in the next step select @timestamp as your Time Filter field.
Hit Create index pattern, and you are ready to analyze the data. Go to the Discover tab in Kibana to take a look at the data (look at today’s data instead of the default last 15 mins).
Congratulations! You have set up your first ELK data pipeline using Elasticsearch, Logstash, and Kibana.
Additional installation guides
As mentioned before, this is just one environment example of installing ELK. There are other systems and platforms covered in other articles on our blog that might be relevant for you:
Check out the other sections of this guide to understand more advanced topics related to working with Elasticsearch, Logstash, Kibana and Beats.
ELASTICSEARCH
What is Elasticsearch?
Elasticsearch is the living heart of what is today the world’s most popular log analytics platform — the ELK Stack (Elasticsearch, Logstash, and Kibana). The role played by Elasticsearch is so central that it has become synonymous with the name of the stack itself. Used primarily for search and log analysis, Elasticsearch is today one of the most popular database systems available today.
Initially released in 2010, Elasticsearch is a modern search and analytics engine which is based on Apache Lucene. Completely open source and built with Java, Elasticsearch is categorized as a NoSQL database. Elasticsearch stores data in an unstructured way, and up until recently you could not query the data using SQL. The new Elasticsearch SQL project will allow using SQL statements to interact with the data. You can read more on that in this article.
Unlike most NoSQL databases, though, Elasticsearch has a strong focus on search capabilities and features — so much so, in fact, that the easiest way to get data from Elasticsearch is to search for it using its extensive REST API.
In the context of data analysis, Elasticsearch is used together with the other components in the ELK Stack, Logstash and Kibana, and plays the role of data indexing and storage.
Elasticsearch is a feature-rich and complex system. Detailing and drilling down into each of its nuts and bolts is impossible. However, there are some basic concepts and terms that all Elasticsearch users should learn and become familiar with. Below are the six “must-know” concepts to start with.
Index
Elasticsearch Indices are logical partitions of documents and can be compared to a database in the world of relational databases.
Continuing our e-commerce app example, you could have one index containing all of the data related to the products and another with all of the data related to the customers.
You can have as many indices defined in Elasticsearch as you want but this can affect performance. These, in turn, will hold documents that are unique to each index.
Indices are identified by lowercase names that are used when performing various actions (such as searching and deleting) against the documents that are inside each index.
Documents
Documents are JSON objects that are stored within an Elasticsearch index and are considered the base unit of storage. In the world of relational databases, documents can be compared to a row in a table.
In the example of our e-commerce app, ou could have one document per product or one document per order. There is no limit to how many documents you can store in a particular index.
Data in documents is defined with fields comprised of keys and values. A key is the name of the field, and a value can be an item of many different types such as a string, a number, a boolean expression, another object, or an array of values.
Documents also contain reserved fields that constitute the document metadata such as _index, _type and _id.
Types
Elasticsearch types are used within documents to subdivide similar types of data wherein each type represents a unique class of documents. Types consist of a name and a mapping (see below) and are used by adding the _type field. This field can then be used for filtering when querying a specific type.
Types are gradually being removed from Elasticsearch. Starting with Elasticsearch 6, indices can have only one mapping type. Starting in version 7.x, specifying types in requests is deprecated. Starting in version 8.x, specifying types in requests will no longer be supported.
Mapping
Like a schema in the world of relational databases, mapping defines the different types that reside within an index. It defines the fields for documents of a specific type — the data type (such as string and integer) and how the fields should be indexed and stored in Elasticsearch.
A mapping can be defined explicitly or generated automatically when a document is indexed using templates. (Templates include settings and mappings that can be applied automatically to a new index.)
Shards
Index size is a common cause of Elasticsearch crashes. Since there is no limit to how many documents you can store on each index, an index may take up an amount of disk space that exceeds the limits of the hosting server. As soon as an index approaches this limit, indexing will begin to fail.
One way to counter this problem is to split up indices horizontally into pieces called shards. This allows you to distribute operations across shards and nodes to improve performance. You can control the amount of shards per index and host these “index-like” shards on any node in your Elasticsearch cluster.
Replicas
To allow you to easily recover from system failures such as unexpected downtime or network issues, Elasticsearch allows users to make copies of shards called replicas. Because replicas were designed to ensure high availability, they are not allocated on the same node as the shard they are copied from. Similar to shards, the number of replicas can be defined when creating the index but also altered at a later stage.
Elasticsearch is built on top of Apache Lucene and exposes Lucene’s query syntax. Getting acquainted with the syntax and its various operators will go a long way in helping you query Elasticsearch.
Boolean Operators
As with most computer languages, Elasticsearch supports the AND, OR, and NOT operators:
jack AND jill — Will return events that contain both jack and jill
ahab NOT moby — Will return events that contain ahab but not moby
tom OR jerry — Will return events that contain tom or jerry, or both
Fields
You might be looking for events where a specific field contains certain terms. You specify that as follows:
name:”Ned Stark”
Ranges
You can search for fields within a specific range, using square brackets for inclusive range searches and curly braces for exclusive range searches:
age:[3 TO 10] — Will return events with age between 3 and 10
price:{100 TO 400} — Will return events with prices between 101 and 399
name:[Adam TO Ziggy] — Will return names between and including Adam and Ziggy
Wildcards, Regexes and Fuzzy Searching
A search would not be a search without the wildcards. You can use the * character for multiple character wildcards or the ? character for single character wildcards.
URI Search
The easiest way to search your Elasticsearch cluster is through URI search. You can pass a simple query to Elasticsearch using the q query parameter. The following query will search your whole cluster for documents with a name field equal to “travis”:
curl “localhost:9200/_search?q=name:travis”
Combined with the Lucene syntax, you can build quite impressive searches. Usually, you’ll have to URL-encode characters such as spaces (it’s been omitted in these examples for clarity):
curl “localhost:9200/_search?q=name:john~1 AND (age:[30 TO 40} OR surname:K*) AND -city”
A number of options are available that allow you to customize the URI search, specifically in terms of which analyzer to use (analyzer), whether the query should be fault-tolerant (lenient), and whether an explanation of the scoring should be provided (explain).
Although the URI search is a simple and efficient way to query your cluster, you’ll quickly find that it doesn’t support all of the features offered to you by Elasticsearch. The full power of Elasticsearch is exposed through Request Body Search. Using Request Body Search allows you to build a complex search request using various elements and query clauses that will match, filter, and order as well as manipulate documents based on multiple criteria.
One of the great things about Elasticsearch is its extensive REST API which allows you to integrate, manage and query the indexed data in countless different ways. Examples of using this API to integrate with Elasticsearch data are abundant, spanning different companies and use cases.
Interacting with the API is easy — you can use any HTTP client but Kibana comes with a built-in tool called Console which can be used for this purpose.
As extensive as Elasticsearch REST APIs are, there is a learning curve. To get started, read the API conventions, learn about the different options that can be applied to the calls, how to construct the APIs and how to filter responses. A good thing to remember is that some APIs change and get deprecated from version to version, and it’s a good best practice to keep tabs on breaking changes.
Below are some of the most common Elasticsearch API categories worth researching. Usage examples are available in the Elasticsearch API 101 article. Of course, Elasticsearch official documentation is an important resource as well.
Elasticsearch Document API
This category of APIs is used for handling documents in Elasticsearch. Using these APIs, for example, you can create documents in an index, update them, move them to another index, or remove them.
Elasticsearch Search API
As its name implies, these API calls can be used to query indexed data for specific information. Search APIs can be applied globally, across all available indices and types, or more specifically within an index. Responses will contain matches to the specific query.
Elasticsearch Indices API
This type of Elasticsearch API allows users to manage indices, mappings, and templates. For example, you can use this API to create or delete a new index, check if a specific index exists or not, and define a new mapping for an index.
Elasticsearch Cluster API
These are cluster-specific API calls that allow you to manage and monitor your Elasticsearch cluster. Most of the APIs allow you to define which Elasticsearch node to call using either the internal node ID, its name or its address.
Elasticsearch Plugins
Elasticsearch plugins are used to extend the basic Elasticsearch functionality in various, specific ways. There are plugins, for example, that add security functionality, discovery mechanisms, and analysis capabilities to Elasticsearch.
Regardless of what functionalities they add, Elasticsearch plugins belong to either of the following two categories: core plugins or community plugins. The former is supplied as part of the Elasticsearch package and are maintained by the Elastic team while the latter is developed by the community and are thus separate entities with their own versioning and development cycles.
Plugin Categories
API Extension
Alerting
Analysis
Discovery
Ingest
Management
Mapper
Security
Snapshot/Restore
Store
Installing Elasticsearch Plugins
Installing core plugins is simple and is done using a plugin manager. In the example below, I’m going to install the EC2 Discovery plugin. This plugin queries the AWS API for a list of EC2 instances based on parameters that you define in the plugin settings :
cd /usr/share/elasticsearch
sudo bin/elasticsearch-plugin install discovery-ec2
Copy
Plugins must be installed on every node in the cluster, and each node must be restarted after installation.
Community plugins are a bit different as each of them has different installation instructions.
Some community plugins are installed the same way as core plugins but require additional Elasticsearch configuration steps.
What’s next?
We described Elasticsearch, detailed some of its core concepts and explained the REST API. To continue learning about Elasticsearch, here are some resources you may find useful:
Efficient log analysis is based on well-structured logs. The structure is what enables you to more easily search, analyze and visualize the data in whatever logging tool you are using. Structure is also what gives your data context. If possible, this structure needs to be tailored to the logs on the application level. In other cases, infrastructure and system logs, for example, it is up to you to give logs their structure by parsing them.
What is Logstash?
In the ELK Stack (Elasticsearch, Logstash and Kibana), the crucial task of parsing data is given to the “L” in the stack – Logstash.
Logstash started out as an open source tool developed to handle the streaming of a large amount of log data from multiple sources. After being incorporated into the ELK Stack, it developed into the stack’s workhorse, in charge of also processing the log messages, enhancing them and massaging them and then dispatching them to a defined destination for storage (stashing).
Thanks to a large ecosystem of plugins, Logstash can be used to collect, enrich and transform a wide array of different data types. There are over 200 different plugins for Logstash, with a vast community making use of its extensible features.
It has not always been smooth sailing for Logstash. Due to some inherent performance issues and design flaws, Logstash has received a decent amount of complaints from users over the years. Side projects were developed to alleviate some of these issues (e.g. Lumberjack, Logstash-Forwarder, Beats), and alternative log aggregators began competing with Logstash.
Yet despite these flaws, Logstash still remains a crucial component of the stack. Big steps have been made to try and alleviate these pains by introducing improvements to Logstash itself, such as a brand new execution engine made available in version 7.0, all ultimately helping to make logging with ELK much more reliable than what it used to be.
Read more about installing and using Logstash in our Logstash tutorial.
Logstash Configuration
Events aggregated and processed by Logstash go through three stages: collection, processing, and dispatching. Which data is collected, how it is processed and where it is sent to, is defined in a Logstash configuration file that defines the pipeline.
Each of these stages is defined in the Logstash configuration file with what are called plugins — “Input” plugins for the data collection stage, “Filter” plugins for the processing stage, and “Output” plugins for the dispatching stage. Both the input and output plugins support codecs that allow you to encode or decode your data (e.g. json, multiline, plain).
Input plugins
One of the things that makes Logstash so powerful is its ability to aggregate logs and events from various sources. Using more than 50 input plugins for different platforms, databases and applications, Logstash can be defined to collect and process data from these sources and send them to other systems for storage and analysis.
The most common inputs used are: file, beats, syslog, http, tcp, udp, stdin, but you can ingest data from plenty of other sources.
Filter plugins
Logstash supports a number of extremely powerful filter plugins that enable you to enrich, manipulate, and process logs. It’s the power of these filters that makes Logstash a very versatile and valuable tool for parsing log data.
Filters can be combined with conditional statements to perform an action if a specific criterion is met.
The most common inputs used are: grok, date, mutate, drop. You can read more about these and other in 5 Logstash Filter Plugins.
Output plugins
As with the inputs, Logstash supports a number of output plugins that enable you to push your data to various locations, services, and technologies. You can store events using outputs such as File, CSV, and S3, convert them into messages with RabbitMQ and SQS, or send them to various services like HipChat, PagerDuty, or IRC. The number of combinations of inputs and outputs in Logstash makes it a really versatile event transformer.
Logstash events can come from multiple sources, so it’s important to check whether or not an event should be processed by a particular output. If you do not define an output, Logstash will automatically create a stdout output. An event can pass through multiple output plugins.
Logstash Codecs
Codecs can be used in both inputs and outputs. Input codecs provide a convenient way to decode your data before it enters the input. Output codecs provide a convenient way to encode your data before it leaves the output.
Some common codecs:
The default “plain” codec is for plain text with no delimitation between events
The “json” codec is for encoding JSON events in inputs and decoding json messages in outputs — note that it will revert to plain text if the received payloads are not in a valid JSON format
The “json_lines” codec allows you either to receive and encode json events delimited by \n or to decode JSON messages delimited by \n in outputs
The “rubydebug,” which is very useful in debugging, allows you to output Logstash events as data Ruby objects
Configuration example
Logstash has a simple configuration DSL that enables you to specify the inputs, outputs, and filters described above, along with their specific options. Order matters, specifically around filters and outputs, as the configuration is basically converted into code and then executed. Keep this in mind when you’re writing your configs, and try to debug them.
Input
The input section in the configuration file defines the input plugin to use. Each plugin has its own configuration options, which you should research before using.
Here we are using the file input plugin. We entered the path to the file we want to collect, and defined the start position as beginning to process the logs from the beginning of the file.
Filter
The filter section in the configuration file defines what filter plugins we want to use, or in other words, what processing we want to apply to the logs. Each plugin has its own configuration options, which you should research before using.
Example:
filter {

grok {

match => { "message" => "%{COMBINEDAPACHELOG}" }

}

date {

match => [ "timestamp" , "dd/MMM/yyyy:HH:mm:ss Z" ]

}

geoip {

source => "clientip"

}

}
Copy
In this example we are processing Apache access logs are applying:
A grok filter that parses the log string and populates the event with the relevant information.
A date filter to parse a date field which is a string as a timestamp field (each Logstash pipeline requires a timestamp so this is a required filter).
A geoip filter to enrich the clientip field with geographical data. Using this filter will add new fields to the event (e.g. countryname) based on the clientip field.
Output
The output section in the configuration file defines the destination to which we want to send the logs to. As before, each plugin has its own configuration options, which you should research before using.
As implied above, Logstash suffers from some inherent issues that are related to its design. Logstash requires JVM to run, and this dependency can be the root cause of significant memory consumption, especially when multiple pipelines and advanced filtering are involved.
Resource shortage, bad configuration, unnecessary use of plugins, changes in incoming logs — all of these can result in performance issues which can in turn result in data loss, especially if you have not put in place a safety net.
There are various ways to employ this safety net, both built into Logstash as well as some that involve adding middleware components to your stack. Here is a list of some best practices that will help you avoid some of the common Logstash pitfalls:
Add a buffer – a recommended method involves adding a queuing layer between Logstash and the destination. The most popular methods use Kafka, Redis and RabbitMQ.
Persistent Queues – a built-in data resiliency feature in Logstash that allows you to store data in an internal queue on disk. Disabled by default — you need to enable the feature in the Logstash settings file.
Dead Letter Queues – a mechanism for storing events that could not be processed on disk. Disabled by default — you need to enable the feature in the Logstash settings file.
Keep it simple – try and keep your Logstash configuration as simple as possible. Don’t use plugins if there is no need to do so.
Test your configs – do not run your Logstash configuration in production until you’ve tested it in a sandbox environment. Use online tools to make sure it doesn’t break your pipeline.
For additional pitfalls to look out for, refer to the 5 Logstash Pitfalls article.
Monitoring Logstash
Logstash automatically records some information and metrics on the node running Logstash, JVM and running pipelines that can be used to monitor performance. To tap into this information, you can use monitoring API.
For example, you can use the Hot Threads API to view Java threads with high CPU and extended execution times:
curl -XGET 'localhost:9600/_node/hot_threads?human=true'

Hot threads at 2019-05-27T08:43:05+00:00, busiestThreads=10:

================================================================================

3.16 % of cpu usage, state: timed_waiting, thread name: 'LogStash::Runner', thread id: 1

java.base@11.0.3/java.lang.Object.wait(Native Method)

java.base@11.0.3/java.lang.Thread.join(Thread.java:1313)

app//org.jruby.internal.runtime.NativeThread.join(NativeThread.java:75)

--------------------------------------------------------------------------------

0.61 % of cpu usage, state: timed_waiting, thread name: '[main]>worker5', thread id: 29

java.base@11.0.3/jdk.internal.misc.Unsafe.park(Native Method)

java.base@11.0.3/java.util.concurrent.locks.LockSupport.parkNanos(LockSupport.java:234)

java.base@11.0.3/java.util.concurrent.locks.AbstractQueuedSynchronizer$ConditionObject.awaitNanos(AbstractQueuedSynchronizer.java:2123)

--------------------------------------------------------------------------------

0.47 % of cpu usage, state: timed_waiting, thread name: '[main]<file', thread id: 32

java.base@11.0.3/jdk.internal.misc.Unsafe.park(Native Method)

java.base@11.0.3/java.util.concurrent.locks.LockSupport.parkNanos(LockSupport.java:234)

java.base@11.0.3/java.util.concurrent.locks.AbstractQueuedSynchronizer.doAcquireSharedNanos(AbstractQueuedSynchronizer.java:1079)
Copy
Alternatively, you can use monitoring UI within Kibana, available under Elastic’s Basic license.
What next?
Logstash is a critical element in your ELK Stack, but you need to know how to use it both as an individual tool and together with the other components in the stack. Below is a list of other resources that will help you use Logstash.
Did we miss something? Did you find a mistake? We’re relying on your feedback to keep this guide up-to-date. Please add your comments at the bottom of the page, or send them to: elk-guide@logz.io
KIBANA
No centralized logging solution is complete without an analysis and visualization tool. Without being able to efficiently query and monitor data, there is little use to only aggregating and storing it. Kibana plays that role in the ELK Stack — a powerful analysis and visualization layer on top of Elasticsearch and Logstash.
What is Kibana?
Completely open source, Kibana is a browser-based user interface that can be used to search, analyze and visualize the data stored in Elasticsearch indices (Kibana cannot be used in conjunction with other databases). Kibana is especially renowned and popular due to its rich graphical and visualization capabilities that allow users to explore large volumes of data.
Kibana can be installed on Linux, Windows and Mac using .zip or tar.gz, repositories or on Docker. Kibana runs on node.js, and the installation packages come built-in with the required binaries. Read more about setting up Kibana in our Kibana tutorial.
Please note that changes have been made in more recent versions to the licensing model, including the inclusion of basic X-Pack features into the default installation packages.
Kibana searches
Searching Elasticsearch for specific log message or strings within these messages is the bread and butter of Kibana. In recent versions of Kibana, improvements and changes to the way searching is done have been applied.
By default, users now use a new querying language called KQL (Kibana Querying Language) to search their data. Users accustomed to the previous method — using Lucene — can opt to do so as well.
Kibana querying is an art unto itself, and there are various methods you can use to perform searches on your data. Here are some of the most common search types:
Free text searches – used for quickly searching for a specific string.
Field-level searches – used for searching for a string within a specific field.
Logical statements – used to combine searches into a logical statement.
Proximity searches – used for searching terms within a specific character proximity.
For a more detailed explanation of the different search types, check out the Kibana Tutorial.
Kibana searches cheat sheet
Below is a list of some tips and best practices for using the above-mentioned search types:
Use free-text searches for quickly searching for a specific string. Use double quotes (“string”) to look for an exact match. Example: “USA“
Use the * wildcard symbol to replace any number of characters and the ? wildcard symbol to replace only one character.
Use the _exists_ prefix for a field to search for logs that have that field. Example: _exists_:response
You can search a range within a field. Examples: If you use brackets [], this means that the results are inclusive. If you use {}, this means that the results are exclusive.
When using logical statements (e.g. AND, OR, TO) within a search, use capital letters. Example: response:[400 TO 500]
Use -,! and NOT to define negative terms. Example: response:[400 TO 500] AND NOT response:404
Proximity searches are useful for searching terms within a specific character proximity. Example: [categovi~2] will a search for all the terms that are within two changes from [categovi]. Proximity searches use a lot of resources – use wisely!
Field level search for non analyzed fields work differently than free text search. Example: If the field value is Error – searching for field:*rror will not return the right answer.
If you don’t specify a logical operator, the default one is OR. Example: searching for Error Exception will run a search for Error OR Exception
Using leading wildcards is a very expensive query and should be avoided when possible.
In Kibana 6.3, a new feature simplifies the search experience and includes auto-complete capabilities. This feature needs to be enabled for use, and is currently experimental.
Kibana autocomplete
To help improve the search experience in Kibana, the autocomplete feature suggests search syntax as you enter your query. As you type, relevant fields are displayed and you can complete the query with just a few clicks. This speeds up the whole process and makes Kibana querying a whole lot simpler.
Kibana filtering
To assist users in searches, Kibana includes a filtering dialog that allows easier filtering of the data displayed in the main view.
To use the dialog, simply click the Add a filter + button under the search box and begin experimenting with the conditionals. Filters can be pinned to the Discover page, named using custom labels, enabled/disabled and inverted.
Kibana visualizations
As mentioned above, Kibana is renowned for visualization capabilities. Using a wide variety of different charts and graphs, you can slice and dice your data any way you want. You can create your own custom visualizations with the help of vega and vega-lite. You will find that you can do almost whatever you want with you data.
Creating visualizations, however, is now always straightforward and can take time. Key to making this process painless is knowing your data. The more you are acquainted with the different nooks and crannies in your data, the easier it is.
Kibana visualizations are built on top of Elasticsearch queries. Using Elasticsearch aggregations (e.g. sum, average, min, mac, etc.), you can perform various processing actions to make your visualizations depict trends in the data.
Visualization types
Visualizations in Kibana are categorized into five different types of visualizations:
In the table below, we describe the main function of each visualization and a usage example:
Vertical Bar Chart: Great for time series data and for splitting lines across fields
URLs over time
Pie Chart: Useful for displaying parts of a whole
Top 5 memory consuming system procs
Area chart: For visualizing time series data and for splitting lines on fields
Users over time
Heat Map: For showing statistical outliers and are often used for latency values
Latency and outliers
Horizontal Bar Chart: Good for showing relationships between two fields
URL and referrer
Line Chart: are a simple way to show time series and are good for splitting lines to show anomalies
Average CPU over time by host
Data Table: Best way to split across multiple fields in a custom way
Top user, host, pod, container by usage
Gauge: A way to show the status of a specific metric using thresholds you define
Memory consumption limits
Metric: Useful visualization for displaying a calculation as a single number
No. of Docker containers run.
Coordinate Map & Region Map: Help add a geographical dimension to IP-based logs
Geographic origin of web server requests.
Timelion and Visual Query Builder: Allows you to create more advanced queries based on time series data
Percentage of 500 errors over time
Markdown: A great way to add a customized text or image-based visualization to your dashboard based on markdown syntax
Company logo or a description of a dashboard
Tag Cloud: Helps display groups of words sized by their importance
Countries sending requests to a web server
Kibana dashboards
Once you have a collection of visualizations ready, you can add them all into one comprehensive visualization called a dashboard. Dashboards give you the ability to monitor a system or environment from a high vantage point for easier event correlation and trend analysis.
Dashboards are highly dynamic — they can be edited, shared, played around with, opened in different display modes, and more. Clicking on one field in a specific visualization within a dashboard, filters the entire dashboard accordingly (you will notice a filter added at the top of the page).
Recent versions of Kibana include dedicated pages for various monitoring features such as APM and infrastructure monitoring. Some of these features were formerly part of the X-Pack, others, such as Canvas and Maps, are brand new:
Canvas – the “photoshop” of machine-generated data, Canvas is an advanced visualization tool that allows you to design and visualize your logs and metrics in creative new ways.
Maps – meant for geospatial analysis, this page supports multiple layers and data sources, the mapping of individual geo points and shapes, global searching for ad-hoc analysis, customization of elements, and more.
Infrastructure – helps you gain visibility into the different components constructing your infrastructure, such as hosts and containers.
Logs – meant for live tracking of incoming logs being shipped into the stack with Logstash.
APM – designed to help you monitor the performance of your applications and identify bottlenecks.
Uptime – allows you to monitor and gauge the status of your applications using a dedicated UI, based on data shipped into the stack with Heartbeat.
Stack Monitoring – provides you with built-in dashboards for monitoring Elasticsearch, Kibana, Logstash and Beats. Requires manual configuration.
Note: These pages are not licensed under Apache 2.0 but under Elastic’s Basic license.
Kibana Elasticsearch index
The searches, visualizations, and dashboards saved in Kibana are called objects. These objects are stored in a dedicated Elasticsearch index (.kibana) for debugging, sharing, repeated usage and backup.
The index is created as soon as Kibana starts. You can change its name in the Kibana configuration file. The index contains the following documents, each containing their own set of fields:
Saved index patterns
Saved searches
Saved visualizations
Saved dashboards
What’s next?
This article covered the functions you will most likely be using Kibana for, but there are plenty more tools to learn about and play around with. There are development tools such as Console, and if you’re using X-Pack, additional monitoring and alerting features.
It’s important to note that for production, you will most likely need to add some elements to Kibana to make it more secure and robust. For example, placing a proxy such as Nginx in front of Kibana or plugging in an alerting layer. This requires additional configuration or costs.
If you’re just getting started with Kibana, read this Kibana Tutorial.
BEATS
The ELK Stack, which traditionally consisted of three main components — Elasticsearch, Logstash, and Kibana, is now also used together with what is called “Beats” — a family of log shippers for different use cases. The advent of the different beats — Filebeat, Metricbeat, Packetbeat, Auditbeat, Heartbeat and Winlogbeat — gave birth to a new title for the stack — “Elastic Stack”.
What are Beats?
Beats are a collection of open source log shippers that act as agents installed on the different servers in your environment for collecting logs or metrics. Written in Go, these shippers were designed to be lightweight in nature — they leave a small installation footprint, are resource efficient, and function with no dependencies.
The data collected by the different beats varies — log files in the case of Filebeat, network data in the case of Packetbeat, system and service metrics in the case of Metricbeat, Windows event logs in the case of Winlogbeat, and so forth. In addition to the beats developed and supported by Elastic, there is also a growing list of beats developed and contributed by the community.
Once collected, you can configure your beat to ship the data either directly into Elasticsearch or to Logstash for additional processing. Some of the beats also support processing which helps offload some of the heavy lifting Logstash is responsible for.
Since version 7.0, Beats comply with the Elastic Common Schema (ECS) introduced at the beginning of 2019. ECS aims at making it easier for users to correlate between data sources by sticking to a uniform field format.
Read about how to install, use and run beats in our Beats Tutorial.
Filebeat
Filebeat is used for collecting and shipping log files. Filebeat can be installed on almost any operating system, including as a Docker container, and also comes with internal modules for specific platforms such as Apache, MySQL, Docker and more, containing default configurations and Kibana objects for these platforms.
Packetbeat
A network packet analyzer, Packetbeat was the first beat introduced. Packetbeat captures network traffic between servers, and as such can be used for application and performance monitoring. Packetbeat can be installed on the server being monitored or on its own dedicated server.
Metricbeat collects ships various system-level metrics for various systems and platforms. Like Filebeat, Metricbeat also supports internal modules for collecting statistics from specific platforms. You can configure the frequency by which Metricbeat collects the metrics and what specific metrics to collect using these modules and sub-settings called metricsets.
Winlogbeat will only interest Windows sysadmins or engineers as it is a beat designed specifically for collecting Windows Event logs. It can be used to analyze security events, updates installed, and so forth.
Auditbeat can be used for auditing user and process activity on your Linux servers. Similar to other traditional system auditing tools (systemd, auditd), Auditbeat can be used to identify security breaches — file changes, configuration changes, malicious behavior, etc.
Functionbeat is defined as a “serverless” shipper that can be deployed as a function to collect and ship data into the ELK Stack. Designed for monitoring cloud environments, Functionbeat is currently tailored for Amazon setups and can be deployed as an Amazon Lambda function to collect data from Amazon CloudWatch, Kinesis and SQS.
Configuring beats
Being based on the same underlying architecture, Beats follow the same structure and configuration rules.
Generally speaking, the configuration file for your beat will include two main sections: one defines what data to collect and how to handle it, the other where to send the data to.
Configuration files are usually located in the same directory — for Linux, this location is the /etc/<beatname> directory. For Filebeat, this would be /etc/filebeat/filebeat.yml, for Metricbeat, /etc/metricbeat/metricbeat.yml. And so forth.
Beats configuration files are based on the YAML format with a dictionary containing a group of key-value pairs, but they can contain lists and strings, and various other data types. Most of the beats also include files with complete configuration examples, useful for learning the different configuration settings that can be used. Use it as a reference.
Beats modules
Filebeat and Metricbeat support modules — built-in configurations and Kibana objects for specific platforms and systems. Instead of configuring these two beats, these modules will help you start out with pre-configured settings which work just fine in most cases but that you can also adjust and fine tune as you see fit.
So, what does a configuration example look like? Obviously, this differs according to the beat in question. Below, however, is an example of a Filebeat configuration that is using a single prospector for tracking Puppet server logs, a JSON directive for parsing, and a local Elasticsearch instance as the output destination.
filebeat.prospectors:

- type: log

enabled: true

paths:

- /var/log/puppetlabs/puppetserver/puppetserver.log.json

- /var/log/puppetlabs/puppetserver/puppetserver-access.log.json

json.keys_under_root: true

output.elasticsearch:

# Array of hosts to connect to.

hosts: ["localhost:9200"]
Copy
Configuration best practices
Each beat contains its own unique configuration file and configuration settings, and therefore requires its own set of instructions. Still, there are some common configuration best practices that can be outlined here to provide a solid general understanding.
Some beats, such as Filebeat, include full example configuration files (e.g, /etc/filebeat/filebeat.full.yml). These files include long lists all the available configuration options.
YAML files are extremely sensitive. DO NOT use tabs when indenting your lines — only spaces. YAML configuration files for Beats are mostly built the same way, using two spaces for indentation.
Use a text editor (I use Sublime) to edit the file.
The ‘-’ (dash) character is used for defining new elements — be sure to preserve their indentations and the hierarchies between sub-constructs.
Additional information and tips are available in the Musings in YAML article.
What next?
Beats are a great and welcome addition to the ELK Stack, taking some of the load off Logstash and making data pipelines much more reliable as a result. Logstash is still a critical component for most pipelines that involve aggregating log files since it is much more capable of advanced processing and data enrichment.
Beats also have some glitches that you need to take into consideration. YAML configurations are always sensitive, and Filebeat, in particular, should be handled with care so as not to create resource-related issues. I cover some of the issues to be aware of in the 5 Filebeat Pitfalls article.
Read more about how to install, use and run beats in our Beats Tutorial.
Did we miss something? Did you find a mistake? We’re relying on your feedback to keep this guide up-to-date. Please add your comments at the bottom of the page, or send them to: elk-guide@logz.io
ELK IN PRODUCTION
Log management has become a must-do action for any organization to resolve problems and ensure that applications are running in a healthy manner. As such, log management has become in essence, a mission-critical system.
When you’re troubleshooting a production issue or trying to identify a security hazard, the system must be up and running around the clock. Otherwise, you won’t be able to troubleshoot or resolve issues that arise — potentially resulting in performance degradation, downtime or security breach. A log analytics system that runs continuously can equip your organization with the means to track and locate the specific issues that are wreaking havoc on your system.
In this section, we will share some of our experiences from building Logz.io. We will detail some of the challenges involved in building an ELK Stack at scale as well as offer some related guidelines.
Generally speaking, there are some basic requirements a production-grade ELK implementation needs to answer:
Save and index all of the log files that it receives (sounds obvious, right?)
Operate when the production system is overloaded or even failing (because that’s when most issues occur)
Keep the log data protected from unauthorized access
Have maintainable approaches to data retention policies, upgrades, and more
How can this be achieved?
Don’t Lose Log Data
If you’re troubleshooting an issue and go over a set of events, it only takes one missing logline to get incorrect results. Every log event must be captured. For example, you’re viewing a set of events in MySQL that ends with a database exception. If you lose one of these events, it might be impossible to pinpoint the cause of the problem.
The recommended method to ensure a resilient data pipeline is to place a buffer in front of Logstash to act as the entry point for all log events that are shipped to your system. It will then buffer the data until the downstream components have enough resources to index.
The most common buffer used in this context is Kafka, though also Redis and RabbitMQ are used.
Elasticsearch is the engine at the heart of ELK. It is very susceptible to load, which means you need to be extremely careful when indexing and increasing your amount of documents. When Elasticsearch is busy, Logstash works slower than normal — which is where your buffer comes into the picture, accumulating more documents that can then be pushed to Elasticsearch. This is critical not to lose log events.
Monitor Logstash/Elasticsearch Exceptions
Logstash may fail when trying to index logs in Elasticsearch that cannot fit into the automatically-generated mapping.
For example, let’s say you have a log entry that looks like this:
timestamp=time, type=my_app, error=3,….
Copy
But later, your system generates a similar log that looks as follows:
timestamp=time, type=my_app, error=”Error”,….
Copy
In the first case, a number is used for the error field. In the second case, a string is used. As a result, Elasticsearch will NOT index the document — it will just return a failure message and the log will be dropped.
To make sure that such logs are still indexed, you need to:
32. Work with developers to make sure they’re keeping log formats consistent. If a log schema change is required, just change the index according to the type of log.
Ensure that Logstash is consistently fed with information and monitor Elasticsearch exceptions to ensure that logs are not shipped in the wrong formats. Using mapping that is fixed and less dynamic is probably the only solid solution here (that doesn’t require you to start coding).
At Logz.io, we solve this problem by building a pipeline to handle mapping exceptions that eventually index these documents in manners that don’t collide with existing mapping.
Keep up with growth and bursts
As your company succeeds and grows, so does your data. Machines pile up, environments diversify, and log files follow suit. As you scale out with more products, applications, features, developers, and operations, you also accumulate more logs. This requires a certain amount of compute resource and storage capacity so that your system can process all of them.
In general, log management solutions consume large amounts of CPU, memory, and storage. Log systems are bursty by nature, and sporadic bursts are typical. If a file is purged from your database, the frequency of logs that you receive may range from 100 to 200 to 100,000 logs per second.
As a result, you need to allocate up to 10 times more capacity than normal. When there is a real production issue, many systems generally report failures or disconnections, which cause them to generate many more logs. This is actually when log management systems are needed more than ever.
ELK Elasticity
One of the biggest challenges of building an ELK deployment is making it scalable.
Let’s say you have an e-commerce site and experience an increasing number of incoming log files during a particular time of year. To ensure that this influx of log data does not become a bottleneck, you need to make sure that your environment can scale with ease. This requires that you scale on all fronts — from Redis (or Kafka), to Logstash and Elasticsearch — which is challenging in multiple ways.
Regardless of where you’re deploying your ELK stack — be it on AWS, GCP, or in your own datacenter — we recommend having a cluster of Elasticsearch nodes that run in different availability zones, or in different segments of a data center, to ensure high availability.
Let’s take a look at some of the components required for a scalable ELK deployment.
Kafka
As mentioned above, placing a buffer in front of your indexing mechanism is critical to handle unexpected events. It could be mapping conflicts, upgrade issues, hardware issues or sudden increases in the volume of logs. Whatever the cause you need an overflow mechanism, and this where Kafka comes into the picture.
Acting as a buffer for logs that are to be indexed, Kafka must persist your logs in at least 2 replicas, and it must retain your data (even if it was consumed already by Logstash) for at least 1-2 days.
This goes against planning for the local storage available to Kafka, as well as the network bandwidth provided to the Kafka brokers. Remember to take into account huge spikes in incoming log traffic (tens of times more than “normal”), as these are the cases where you will need your logs the most.
Consider how much manpower you will have to dedicate to fixing issues in your infrastructure when planning the retention capacity in Kafka.
Another important consideration is the ZooKeeper management cluster – it has its own requirements. Do not overlook the disk performance requirements for ZooKeeper, as well as the availability of that cluster. Use a three or five node cluster, spread across racks/availability zones (but not regions).
One of the most important things about Kafka is the monitoring implemented on it. You should always be looking at your log consumption (aka “Lag”) in terms of the time it takes from when a log message is published to Kafka until after it has been indexed in Elasticsearch and is available for search.
Kafka also exposes a plethora of operational metrics, some of which are extremely critical to monitor: network bandwidth, thread idle percent, under-replicated partitions and more. When considering consumption from Kafka and indexing you should consider what level of parallelism you need to implement (after all, Logstash is not very fast). This is important to understand the consumption paradigm and plan the number of partitions you are using in your Kafka topics accordingly.
Logstash
Knowing how many Logstash instances to run is an art unto itself and the answer depends on a great many of factors: volume of data, number of pipelines, size of your Elasticsearch cluster, buffer size, accepted latency — to name just a few. Deploy a scalable queuing mechanism with different scalable workers. When a queue is too busy, scale additional workers to read into Elasticsearch. Once you’ve determined the number of Logstash instances required, run each one of them in a different AZ (on AWS). This comes at a cost due to data transfer but will guarantee a more resilient data pipeline. You should also separate Logstash and Elasticsearch by using different machines for them. This is critical because they both run as JVMs and consume large amounts of memory, which makes them unable to run on the same machine effectively. Hardware specs vary, but it is recommended allocating a maximum of 30 GB or half of the memory on each machine for Logstash. In some scenarios, however, making room for caches and buffers is also a good best practice.
Elasticsearch cluster
Elasticsearch is composed of a number of different node types, two of which are the most important: the master nodes and the data nodes. The master nodes are responsible for cluster management while the data nodes, as the name suggests, are in charge of the data (read more about setting up an Elasticsearch cluster here).
We recommend building an Elasticsearch cluster consisting of at least three master nodes because of the common occurrence of split brain, which is essentially a dispute between two nodes regarding which one is actually the master.
As far as the data nodes go, we recommend having at least two data nodes so that your data is replicated at least once. This results in a minimum of five nodes: the three master nodes can be small machines, and the two data nodes need to be scaled on solid machines with very fast storage and a large capacity for memory.
Run in Different AZs (But Not in Different Regions)
We recommend having your Elasticsearch nodes run in different availability zones or in different segments of a data center to ensure high availability. This can be done through an Elasticsearch setting that allows you to configure every document to be replicated between different AZs. As with Logstash, the resulting costs resulting from this kind of deployment can be quite steep due to data transfer.
Security
Due to the fact that logs may contain sensitive data, it is crucial to protect who can see what. How can you limit access to specific dashboards, visualizations, or data inside your log analytics platform? There is no simple way to do this in the ELK Stack.
One option is to use nginx reverse proxy to access your Kibana dashboard, which entails a simple nginx configuration that requires those who want to access the dashboard to have a username and password. This quickly blocks access to your Kibana console and allows you to configure authentication as well as add SSL/TLS encryption Elastic
Elastic recently announced making some security features free, incl. encryption, role-based access, and authentication. More advanced security configurations and integrations, however, e.g. LDAP/AD support, SSO, encryption at rest, are not available out of the box. Keep in mind that while these features are indeed free of charge, they are not completely open source.
Another option is SearchGuard which provides a free security plugin for Elasticsearch including role-based access control and SSL/TLS encrypted node-to-node communication. It’s also worth mentioning Amazon’s OpenDistro for Elasticsearch that comes built in with an open source security plugin with similar capabilities.
Last but not least, be careful when exposing Elasticsearch because it is very susceptible to attacks. There are some basic steps to take that will help you secure your Elasticsearch instances.
Maintainability
Log Data Consistency
Logstash processes and parses logs in accordance with a set of rules defined by filter plugins. Therefore, if you have an access log from nginx, you want the ability to view each field and have visualizations and dashboards built based on specific fields. You need to apply the relevant parsing abilities to Logstash — which has proven to be quite a challenge, particularly when it comes to building groks, debugging them, and actually parsing logs to have the relevant fields for Elasticsearch and Kibana.
At the end of the day, it is very easy to make mistakes using Logstash, which is why you should carefully test and maintain all of your log configurations by means of version control. That way, while you may get started using nginx and MySQL, you may incorporate custom applications as you grow that result in large and hard-to-manage log files. The community has generated a lot of solutions around this topic, but trial and error are extremely important with open source tools before using them in production.
Data Retention
Another aspect of maintainability comes into play with excess indices. Depending on how long you want to retain data, you need to have a process set up that will automatically delete old indices — otherwise, you will be left with too much data and your Elasticsearch will crash, resulting in data loss.
To prevent this from happening, you can use Elasticsearch Curator to delete indices. We recommend having a cron job that automatically spawns Curator with the relevant parameters to delete any old indices, ensuring you don’t end up holding too much data. It is commonly required to save logs to S3 in a bucket for compliance, so you want to be sure to have a copy of the logs in their original format.
Upgrades
Major versions of the stack are released quite frequently, with great new features but also breaking changes. It is always wise to read and do research on what these changes mean for your environment before you begin upgrading. Latest is not always the greatest!
Performing Elasticsearch upgrades can be quite an endeavor but has also become safer due to some recent changes. First and foremost, you need to make sure that you will not lose any data as a result of the process. Run tests in a non-production environment first. Depending on what version you are upgrading from and to, be sure you understand the process and what it entails.
Logstash upgrades are generally easier, but pay close attention to the compatibility between Logstash and Elasticsearch and breaking changes.
Kibana upgrades can be problematic, especially if you’re running on an older version. Importing objects is “generally” supported, but you should backup your objects and test the upgrade process before upgrading in production. As always — study breaking changes!
Summary
Getting started with ELK to process logs from a server or two is easy and fun. Like any other production system, it takes much more work to reach a solid production deployment. We know this because we’ve been working with many users who struggle with making ELK operational in production. Read more about the real cost of doing ELK on your own.
Did we miss something? Did you find a mistake? We’re relying on your feedback to keep this guide up-to-date. Please add your comments at the bottom of the page, or send them to: elk-guide@logz.io
COMMON PITFALLS
Like any piece of software, the ELK Stack is not without its pitfalls. While relatively easy to set up, the different components in the stack can become difficult to handle as soon as you move on to complex setups and a larger scale of operations necessary for handling multiple data pipelines.
There’s nothing like trial and error. At the end of the day, the more you do, the more you err and learn along the way. At Logz.io, we have accumulated a decent amount of Elasticsearch, Logstash and Kibana time, and are happy to share our hard-earned lessons with our readers.
There are several common, and yet sometimes critical, mistakes that users tend to make while using the different components in the stack. Some are extremely simple and involve basic configurations, others are related to best practices. In this section of the guide, we will outline some of these mistakes and how you can avoid making them.
Elasticsearch
Not defining Elasticsearch mapping
Say that you start Elasticsearch, create an index, and feed it with JSON documents without incorporating schemas. Elasticsearch will then iterate over each indexed field of the JSON document, estimate its field, and create a respective mapping. While this may seem ideal, Elasticsearch mappings are not always accurate. If, for example, the wrong field type is chosen, then indexing errors will pop up.
To fix this issue, you should define mappings, especially in production-line environments. It’s a best practice to index a few documents, let Elasticsearch guess the field, and then grab the mapping it creates with GET /index_name/doc_type/_mapping. You can then take matters into your own hands and make any appropriate changes that you see fit without leaving anything up to chance.
For example, if you index your first document like this:
In this case, “payload” of course is not a date, and an error message may pop up and the new index will not be saved because Elasticsearch has already marked it as “date.”
Capacity Provisioning
Provisioning can help to equip and optimize Elasticsearch for operational performance. It requires that Elasticsearch is designed in such a way that will keep nodes up, stop memory from growing out of control, and prevent unexpected actions from shutting down nodes.
“How much space do I need?” is a question that users often ask themselves. Unfortunately, there is no set formula, but certain steps can be taken to assist with the planning of resources.
First, simulate your actual use-case. Boot up your nodes, fill them with real documents, and push them until the shard breaks.
Still, be sure to keep in mind that the concept of “start big and scale down” can save you time and money when compared to the alternative of adding and configuring new nodes when your current amount is no longer enough.
Once you define a shard’s capacity, you can easily apply it throughout your entire index. It is very important to understand resource utilization during the testing process because it allows you to reserve the proper amount of RAM for nodes, configure your JVM heap space, and optimize your overall testing process.
Oversized Template
Large templates are directly related to large mappings. In other words, if you create a large mapping for Elasticsearch, you will have issues with syncing it across your nodes, even if you apply them as an index template.
The issues with big index templates are mainly practical — you might need to do a lot of manual work with the developer as the single point of failure — but they can also relate to Elasticsearch itself. Remember: You will always need to update your template when you make changes to your data model.
Production Fine-tuning
By default, the first cluster that Elasticsearch starts is called elasticsearch. If you are unsure about how to change a configuration, it’s best to stick to the default configuration. However, it is a good practice to rename your production cluster to prevent unwanted nodes from joining your cluster.
Below is an example of how you might want to rename your cluster and nodes:
This is one of the main pain points not only for working with Logstash but for the entire stack. Having your entire ELK-based pipelines stalled because of a bad Logstash configuration error is not an uncommon occurrence.
Hundreds of different plugins with their own options and syntax instructions, differently located configuration files, files that tend to become complex and difficult to understand over time — these are just some of the reasons why Logstash configuration files are the cemetery of many a pipeline.
As a rule of the thumb, try and keep your Logstash configuration file as simple as possible. This also affects performance. Use only the plugins you are sure you need. This is especially true of the various filter plugins which tend to add up necessarily.
If possible — test and verify your configurations before starting Logstash in production. If you’re running Logstash from the command line, use the –config.test_and_exit parameter. Use the grok debugger to test your grok filter.
Memory consumption
Logstash runs on JVM and consumes a hefty amount of resources to do so. Many discussions have been floating around regarding Logstash’s significant memory consumption. Obviously, this can be a great challenge when you want to send logs from a small machine (such as AWS micro instances) without harming application performance.
Recent versions of Logstash and the ELK Stack have improved this inherent weakness. The new execution engine was introduced in version 7.x promises to speed up performance and the resource footprint Logstash has.
Also, Filebeat and/or Elasticsearch Ingest Node, can help with outsourcing some of the processing heavy lifting to the other components in the stack. You can also make use of monitoring APIs to identify bottlenecks and problematic processing.
Slow processing
Limited system resources, a complex or faulty configuration file, or logs not suiting the configuration can result in extremely slow processing by Logstash that might result in data loss.
You need to closely monitor key system metrics to make sure you’re keeping tabs on Logstash processing — monitor the host’s CPU, I/O, memory and JVM heap. Be ready to fine-tune your system configurations accordingly (e.g. raising the JVM heap size or raising the number of pipeline workers). There is a nice performance checklist here.
Key-Value Filter Plugin
Key-values is a filter plug-in that extracts keys and values from a single log using them to create new fields in the structured data format. For example, let’s say a logline contains “x=5”. If you pass that through a key-value filter, it will create a new field in the output JSON format where the key would be “x” and the value would be “5”.
By default, the key-value filter will extract every key=value pattern in the source field. However, the downside is that you don’t have control over the keys and values that are created when you let it work automatically, out-of-the-box with the default configuration. It may create many keys and values with an undesired structure, and even malformed keys that make the output unpredictable. If this happens, Elasticsearch may fail to index the resulting document and parse irrelevant information.
Kibana
Elasticsearch connectivity
Kibana is a UI for analyzing the data indexed in Elasticsearch– A super-useful UI at that, but still, only a UI. As such, how Kibana and Elasticsearch talk to each other directly influences your analysis and visualization workflow. It’s easy to miss some basic steps needed to make sure the two behave nicely together.
Defining an index pattern
There’s little use for of an analysis tool if there is no data for it to analyze. If you have no data indexed in Elasticsearch or have not defined the correct index pattern for Kibana to read from, your analysis work cannot start.
So, verify that a) your data pipeline is working as expected and indexing data in Elasticsearch (you can do this by querying Elasticsearch indices), and b) you have defined the correct index pattern in Kibana (Management → Index Patterns in Kibana).
Can not connect to Elasticsearch
A common glitch when setting up Kibana is to misconfigure the connection with Elasticsearch, resulting in the following message when you open Kibana:
As the message reads, Kibana simply cannot connect to an Elasticsearch instance. There are some simple reasons for this — Elasticsearch may not be running, or Kibana might be configured to look for an Elasticsearch instance on a wrong host and port.
The latter is the more common reason for seeing the above message, so open the Kibana configuration file and be sure to define the IP and port of the Elasticsearch instance you want Kibana to connect to.
Bad Kibana searches
Querying Elasticsearch from Kibana is an art because many different types of searches are available. From free-text searches to field-level and regex searches, there are many options, and this variety is one of the reasons that people opt for the ELK Stack in the first place. As implied in the opening statement above, some Kibana searches are going to crash Elasticsearch in certain circumstances.
For example, using a leading wildcard search on a large dataset has the potential of stalling the system and should, therefore, be avoided.
Try and avoid using wildcard queries if possible, especially when performed against very large data sets.
Advanced settings
Some Kibana-specific configurations can cause your browser to crash. For example, depending on your browser and system settings, changing the value of the discover:sampleSize setting to a high number can easily cause Kibana to freeze.
That is why the good folks at Elastic have placed a warning at the top of the page that is supposed to convince us to be extra careful. Anyone with a guess on how successful this warning is?
Beats
The log shippers belonging to the Beats family are pretty resilient and fault-tolerant. They were designed to be lightweight in nature and with a low resource footprint.
YAML configuration files
The various beats are configured with YAML configuration files. YAML being YAML, these configurations are extremely syntax sensitive. You can find a list of tips for writing these files in this article, but generally speaking, it’s best to handle these files carefully — validate your files using an online YAML validator, makes use of the example files provided in the different packages, and use spaces instead of tabs.
Filebeat – CPU Usage
Filebeat is an extremely lightweight shipper with a small footprint, and while it is extremely rare to find complaints about Filebeat, there are some cases where you might run into high CPU usage.
One factor that affects the amount of computation power used is the scanning frequency — the frequency at which Filebeat is configured to scan for files. This frequency can be defined for each prospector using the scan_frequency setting in your Filebeat configuration file, so if you have a large number of prospectors running with a tight scan frequency, this may result in excessive CPU usage.
Filebeat – Registry File
Filebeat is designed to remember the previous reading for each log file being harvested by saving its state. This helps Filebeat ensure that logs are not lost if, for example, Elasticsearch or Logstash suddenly go offline (that never happens, right?).
This position is saved to your local disk in a dedicated registry file, and under certain circumstances, when creating a large number of new log files, for example, this registry file can become quite large and begin to consume too much memory.
It’s important to note that there are some good options for making sure you don’t fall into this caveat — you can use the clean_removed option, for example, to tell Filebeat to clean non-existing files from the registry file.
Filebeat – Removed or Renamed Log Files
File handlers for removed or renamed log files might exhaust disk space. As long as a harvester is open, the file handler is kept running. Meaning that if a file is removed or renamed, Filebeat continues to read the file, the handler consuming resources. If you have multiple harvesters working, this comes at a cost.
Again, there are workarounds for this. You can use the close_inactive configuration setting to tell Filebeat to close a file handler after identifying inactivity for a defined duration and the closed_removed setting can be enabled to tell Filebeat to shut down a harvester when a file is removed (as soon as the harvester is shut down, the file handler is closed and this resource consumption ends.)
Summing it up
The ELK Stack is a fantastic piece of software with some known and some less-known weak spots.
The good news is that all of the issues listed above can be easily mitigated and avoided as described. The bad news is that there are additional pitfalls that have not been detailed here.
Here are some articles with more tips and best practices to help avoid them:
Did we miss something? Did you find a mistake? We’re relying on your feedback to keep this guide up-to-date. Please add your comments at the bottom of the page, or send them to: elk-guide@logz.io
USE CASES
The ELK Stack is most commonly used as a log analytics tool. Its popularity lies in the fact that it provides a reliable and relatively scalable way to aggregate data from multiple sources, store it and analyze it. As such, the stack is used for a variety of different use cases and purposes, ranging from development to monitoring, to security and compliance, to SEO and BI.
Before you decide to set up the stack, understand your specific use case first. This directly affects almost all the steps implemented along the way — where and how to install the stack, how to configure your Elasticsearch cluster and which resources to allocate to it, how to build data pipelines, how to secure the installation — the list is endless.
So, what are you going to be using ELK for?
Development and troubleshooting
Logs are notorious for being in handy during a crisis. The first place one looks at when an issue takes place are your error logs and exceptions. Yet, logs come in handy much earlier in an application’s lifecycle.
We are strong believers in log-driven development, where logging starts from the very first function written and then subsequently instrumented throughout the entire application. Implementing logging into your code adds a measure of observability into your applications that come in handy when troubleshooting issues.
Whether you are developing a monolith or microservices, the ELK Stack comes into the picture early on as a means for developers to correlate, identify and troubleshoot errors and exceptions taking place, preferably in testing or staging, and before the code goes into production. Using a variety of different appenders, frameworks, libraries and shippers, log messages are pushed into the ELK Stack for centralized management and analysis.
Once in production, Kibana dashboards are used for monitoring the general health of applications and specific services. Should an issue take place, and if logging was instrumented in a structured way, having all the log data in one centralized location helps make analysis and troubleshooting a more efficient and speedy process.
Cloud operations
Modern IT environments are multilayered and distributed in nature, posing a huge challenge for the teams in charge of operating and monitoring them. Monitoring across all the different systems and components comprising an application’s architecture is extremely time and resource consuming.
To be able to accurately gauge and monitor the status and general health of an environment, DevOps and IT Operations teams need to take into account the following key considerations: how to access each machine, how to collect the data, how to add context to the data and process it, where to store the data and how long to store it for, how to analyze the data, how to secure the data and how to back it up.
The ELK Stack helps by providing organizations with the means to tackle these questions by providing an almost all-in-one solution. Beats can be deployed on machines to act as agents forwarding log data to Logstash instances. Logstash can be configured to aggregate the data and process it before indexing the data in Elasticsearch. Kibana is then used to analyze the data, detect anomalies, perform root cause analysis, and build beautiful monitoring dashboards.
And it’s not just logs. While Elasticsearch was initially designed for full-text search and analysis, it is increasingly being used for metrics analysis as well. Monitoring performance metrics for each component in your architecture is key for gaining visibility into operations. Collecting these metrics can be done using 3rd party auditing or monitoring agents or even using some of the available beats (e.g. Metricbeat, Packetbeat) and Kibana now ships with new visualization types to help analyze time series (Timelion, Visual Builder).
Application performance monitoring (APM)
Application Performance Monitoring, aka APM, is one of the most common methods used by engineers today to measure the availability, response times and behavior of applications and services.
Elastic APM is an application performance monitoring system which is built on top of the ELK Stack. Similar to other APM solutions in the market, Elastic APM allows you to track key performance-related information such as requests, responses, database transactions, errors, etc.
Likewise, open source distributed tracing tools such as Zipkin and Jaeger can be integrated with ELK for diving deep into application performance.
Security and compliance
Security has always been crucial for organizations. Yet over the past few years, because of both an increase in the frequency of attacks and compliance requirements (HIPAA, PCI, SOC, FISMA, etc.), employing security mechanisms and standards has become a top priority.
Because log data contains a wealth of valuable information on what is actually happening in real time within running processes, it should come as little surprise that security is fast becoming a strong use case for the ELK Stack.
Despite the fact that as a standalone stack, ELK does not come with security features built-in, the fact that you can use it to centralize logging from your environment and create monitoring and security-orientated dashboards has led to the integration of the stack with some prominent security standards.
Here are two examples of how the ELK Stack can be implemented as part of a security-first deployment.
1.Anti-DDoS
Once a DDoS attack is mounted, time is of the essence. Quick identification is key to minimizing the damage, and that’s where log monitoring comes into the picture. Logs contain the raw footprint generated by running processes and thus offer a wealth of information on what is happening in real time.
Using the ELK Stack, organizations can build a system that aggregates data from the different layers in an IT environment (web server, databases, firewalls, etc.), process the data for easier analysis and visualizes the data in powerful monitoring dashboards.
2.SIEM
SIEM is an approach to enterprise security management that seeks to provide a holistic view of an organization’s IT security. The main purpose of SIEM is to provide a simultaneous and comprehensive view of your IT security. The SIEM approach includes a consolidated dashboard that allows you to identify activity, trends, and patterns easily. If implemented correctly, SIEM can prevent legitimate threats by identifying them early, monitoring online activity, providing compliance reports, and supporting incident-response teams.
The ELK Stack can be instrumental in achieving SIEM. Take an AWS-based environment as an example. Organizations using AWS services have a large amount of auditing and logging tools that generate log data, auditing information and details on changes made to the configuration of the service. These distributed data sources can be tapped and used together to give a good and centralized security overview of the stack.
Business Intelligence (BI) is the use of software, tools, and applications to analyze an organization’s raw data with the goal of optimizing decisions, improving collaboration, and increasing overall performance.
The process involves collecting and analyzing large sets of data from varied data sources: databases, supply chains, personnel records, manufacturing data, sales and marketing campaigns, and more. The data itself might be stored in internal data warehouses, private clouds or public clouds, and the engineering involved in extracting and processing the data (ETL) has given rise to a number of technologies, both proprietary and open source. As with the previous use cases outlined here, the ELK Stack comes in handy for pulling data from these varied data sources into one centralized location for analysis. For example, we might pull web server access logs to learn how our users are accessing our website, We might tap into our CRM system to learn more about our leads and users, or we might check out the data our marketing automation tool provides.
There are a whole bunch of proprietary tools used for precisely this purpose. But the ELK Stack is a cheaper and open source option to perform almost all of the actions these tools provide.
SEO
Technical SEO is another edge use case for the ELK Stack but a relevant one nonetheless. What has SEO to do with ELK? Well, the common denominator is of course logs.
Web server access logs (Apache, nginx, IIS) reflect an accurate picture of who is sending requests to your website, including requests made by bots belonging to search engines crawling the site. SEO experts will be using this data to monitor the number of requests made by Baidu, BingBot, GoogleBot, Yahoo, Yandex and others.
Technical SEO experts use log data to monitor when bots last crawled the site but also to optimize crawl budget, website errors and faulty redirects, crawl priority, duplicate crawling, and plenty more. Check out our guide on how to use log data for technical SEO.
INTEGRATIONS
Almost any data source can be tapped into to ship log data into the ELK Stack. What method you choose will depend on your requirements, specific environment, preferred toolkit, and many more.
Over the last few years, we have written a large number of articles describing different ways to integrate the ELK Stack with different systems, applications and platforms. The method varies from a data source to data source — it could be a Docker container, Filebeat or another beat, Logstash and so forth. Just take your pick.
Below, is a list of these integrations just in case you’re looking into implementing it. We’ve tried to categorize them into separate categories for easier navigation.
Please note that most include Logz.io-specific instructions as well, including ready-made dashboards that are part of our ELK Apps library. Integrations with instructions for integrating with the Logz.io ELK are marked.
Up until a year or two ago, the ELK Stack was a collection of three open-source products: Elasticsearch, Logstash, and Kibana – all developed, managed and maintained by Elastic. The introduction and subsequent addition of Beats turned the stack into a four-legged project and led to a renaming of the stack as the Elastic Stack.
What are Beats?
Beats are a collection of open-source log shippers that act as agents installed on the different servers in your environment for collecting logs or metrics. Written in Go, these shippers were designed to be lightweight in nature — they leave a small installation footprint, are resource-efficient, and function with no dependencies.
What is the ELK Stack used for?
The ELK Stack is most commonly used as a log analytics tool. Its popularity lies in the fact that it provides a reliable and relatively scalable way to aggregate data from multiple sources, store it and analyze it. As such, the stack is used for a variety of different use cases and purposes, ranging from development to monitoring, to security and compliance, to SEO and BI.


/cdn.vox-cdn.com/uploads/chorus_asset/file/22733187/acastro_072121_4674_zuckerberg_3.jpg)