Install Kibana 7.6 with Docker
Kibana is available as Docker images. The images use centos:7 as the base image.
A list of all published Docker images and tags is available at www.docker.elastic.co.
Pulling the image
Issue a docker pull command against the Elastic Docker registry:
$ docker pull docker.elastic.co/kibana/kibana:7.6.2
Running Kibana on Docker for development
Kibana can be quickly started and connected to a local Elasticsearch container for development or testing use with the following command:
$ docker ps
CONTAINER ID        IMAGE                                                 COMMAND                  CREATED             STATUS              PORTS                                            NAMES
e49fee1e070a        docker.elastic.co/logstash/logstash:7.6.2             "/usr/local/bin/dock…"   12 minutes ago      Up 12 minutes                                                        friendly_antonelli
addeb5426f0a        docker.elastic.co/beats/filebeat:7.6.2                "/usr/local/bin/dock…"   11 hours ago        Up 11 hours                                                          filebeat
caa1097bc4af        docker.elastic.co/elasticsearch/elasticsearch:7.6.2   "/usr/local/bin/dock…"   2 days ago          Up 2 days           0.0.0.0:9200->9200/tcp, 0.0.0.0:9300->9300/tcp   nifty_mayer

$ docker run --link caa1097bc4af:elasticsearch -p 5601:5601 docker.elastic.co/kibana/kibana:7.6.2
...
{"type":"log","@timestamp":"2020-03-31T16:33:14Z","tags":["listening","info"],"pid":6,"message":"Server running at http://0:5601"}
{"type":"log","@timestamp":"2020-03-31T16:33:14Z","tags":["info","http","server","Kibana"],"pid":6,"message":"http server running at http://0:5601"}


$ docker ps
CONTAINER ID        IMAGE                                                 COMMAND                  CREATED             STATUS              PORTS                                            NAMES
620c39470d7f        docker.elastic.co/kibana/kibana:7.6.2                 "/usr/local/bin/dumb…"   2 hours ago         Up 2 hours          0.0.0.0:5601->5601/tcp                           dazzling_chatterjee
e49fee1e070a        docker.elastic.co/logstash/logstash:7.6.2             "/usr/local/bin/dock…"   3 hours ago         Up 3 hours                                                           friendly_antonelli
addeb5426f0a        docker.elastic.co/beats/filebeat:7.6.2                "/usr/local/bin/dock…"   14 hours ago        Up 14 hours                                                          filebeat
caa1097bc4af        docker.elastic.co/elasticsearch/elasticsearch:7.6.2   "/usr/local/bin/dock…"   2 days ago          Up 2 days           0.0.0.0:9200->9200/tcp, 0.0.0.0:9300->9300/tcp   nifty_mayer
Accessing_Kibana
Kibana is a web application that we can access through port 5601. All we need to do is point our web browser at the machine where Kibana is running and specify the port number. For example, localhost:5601 or http://YOURDOMAIN.com:5601. If we want to allow remote users to connect, set the parameter server.host in kibana.yml to a non-loopback address.
When we access Kibana, the Discover page loads by default with the default index pattern selected. The time filter is set to the last 15 minutes and the search query is set to match-all (\*).
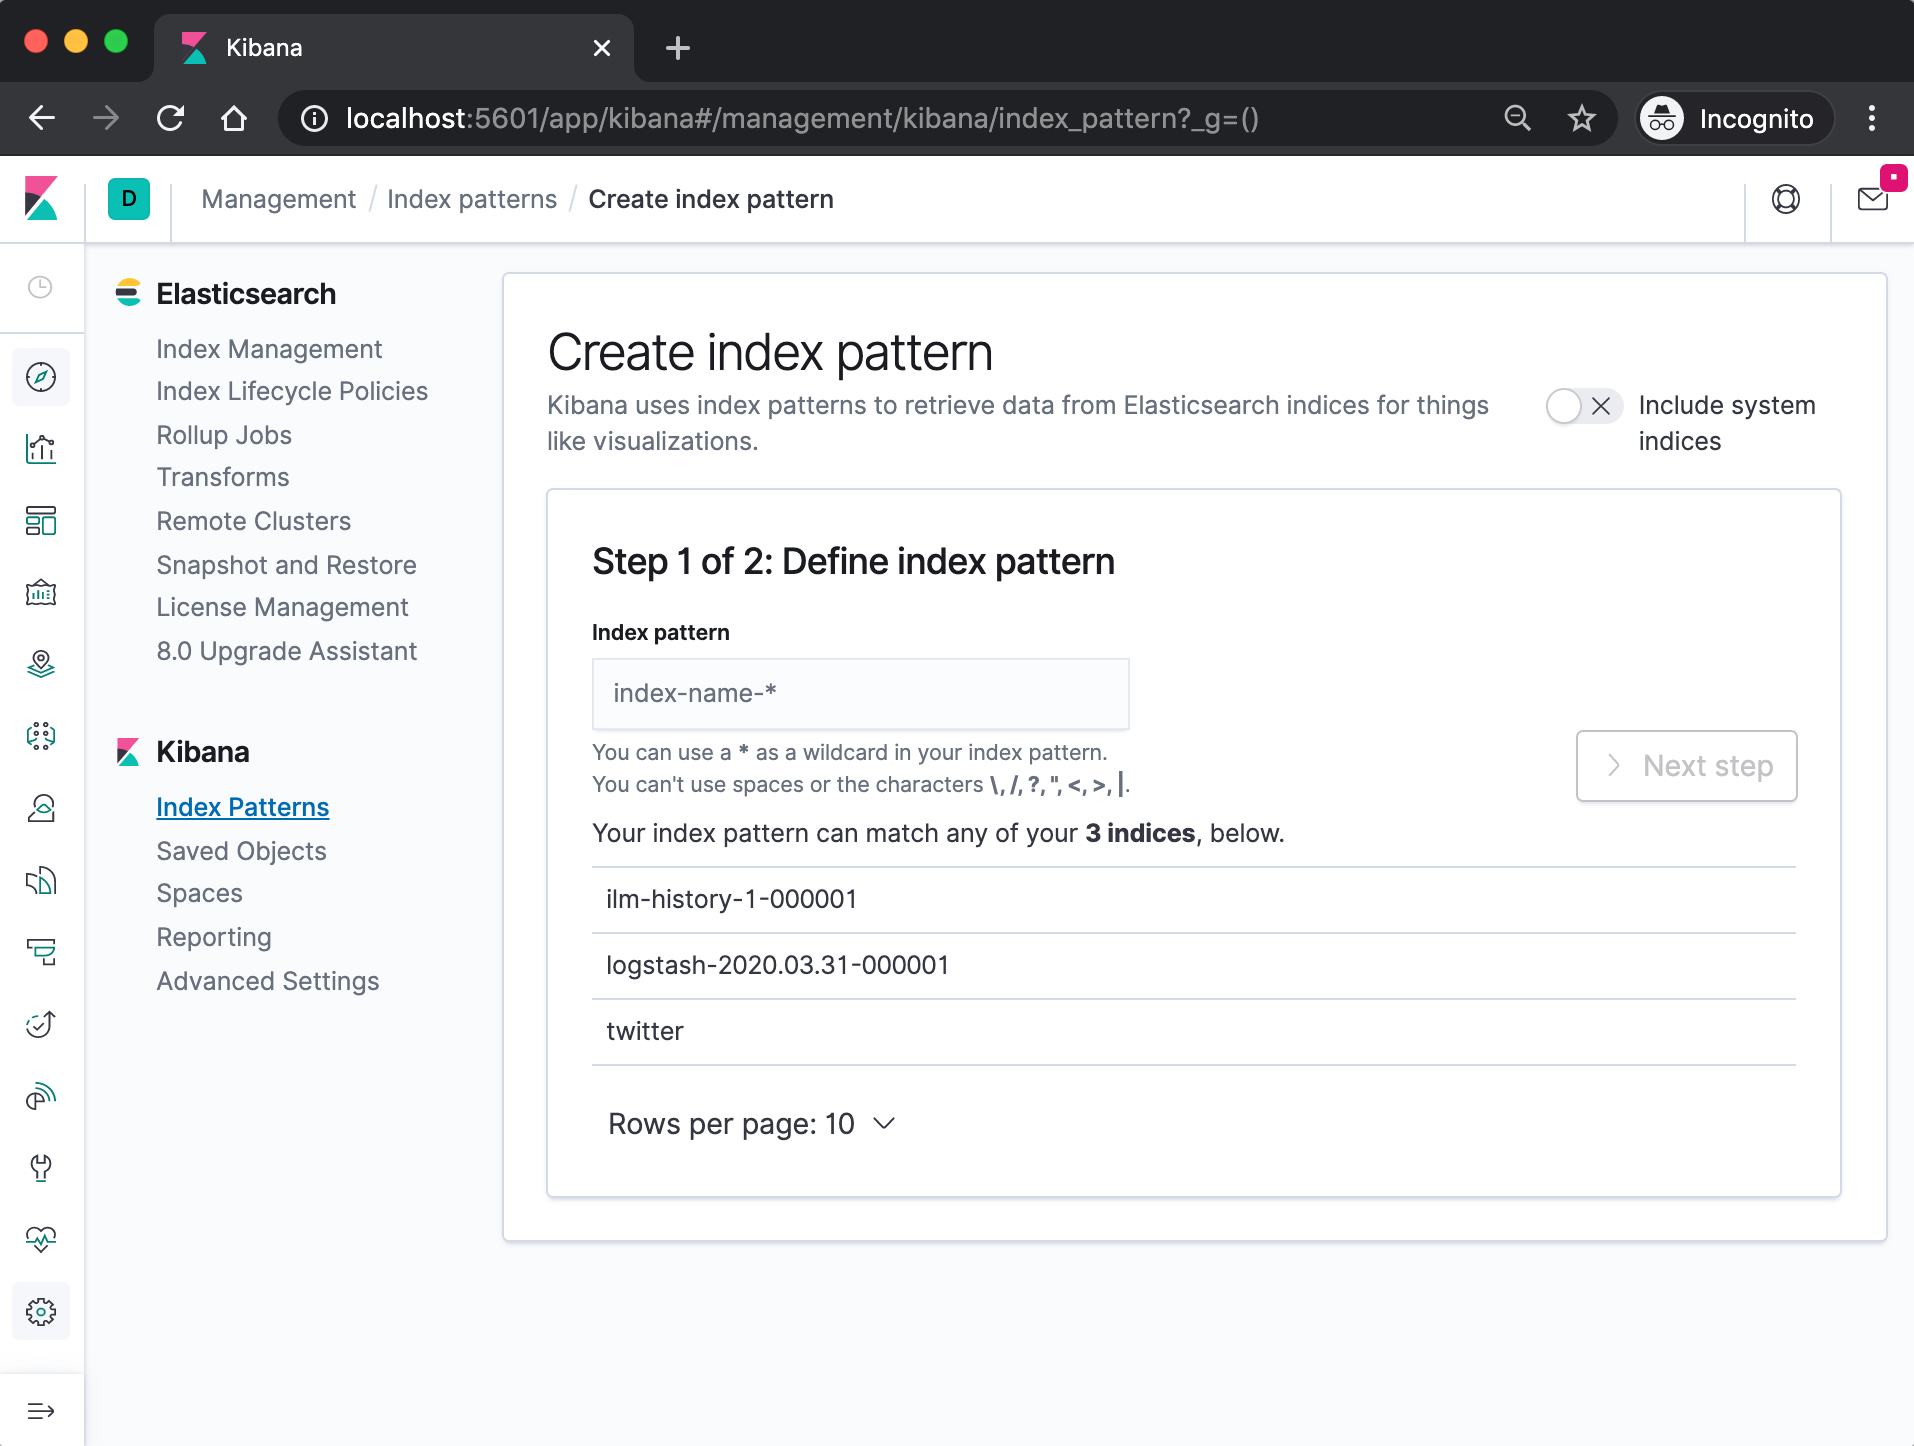
Specify an index pattern that matches the name of one or more of our Elasticsearch indices. The pattern can include an asterisk (*) to matches zero or more characters in an index’s name. When filling out our index pattern, any matched indices will be displayed.
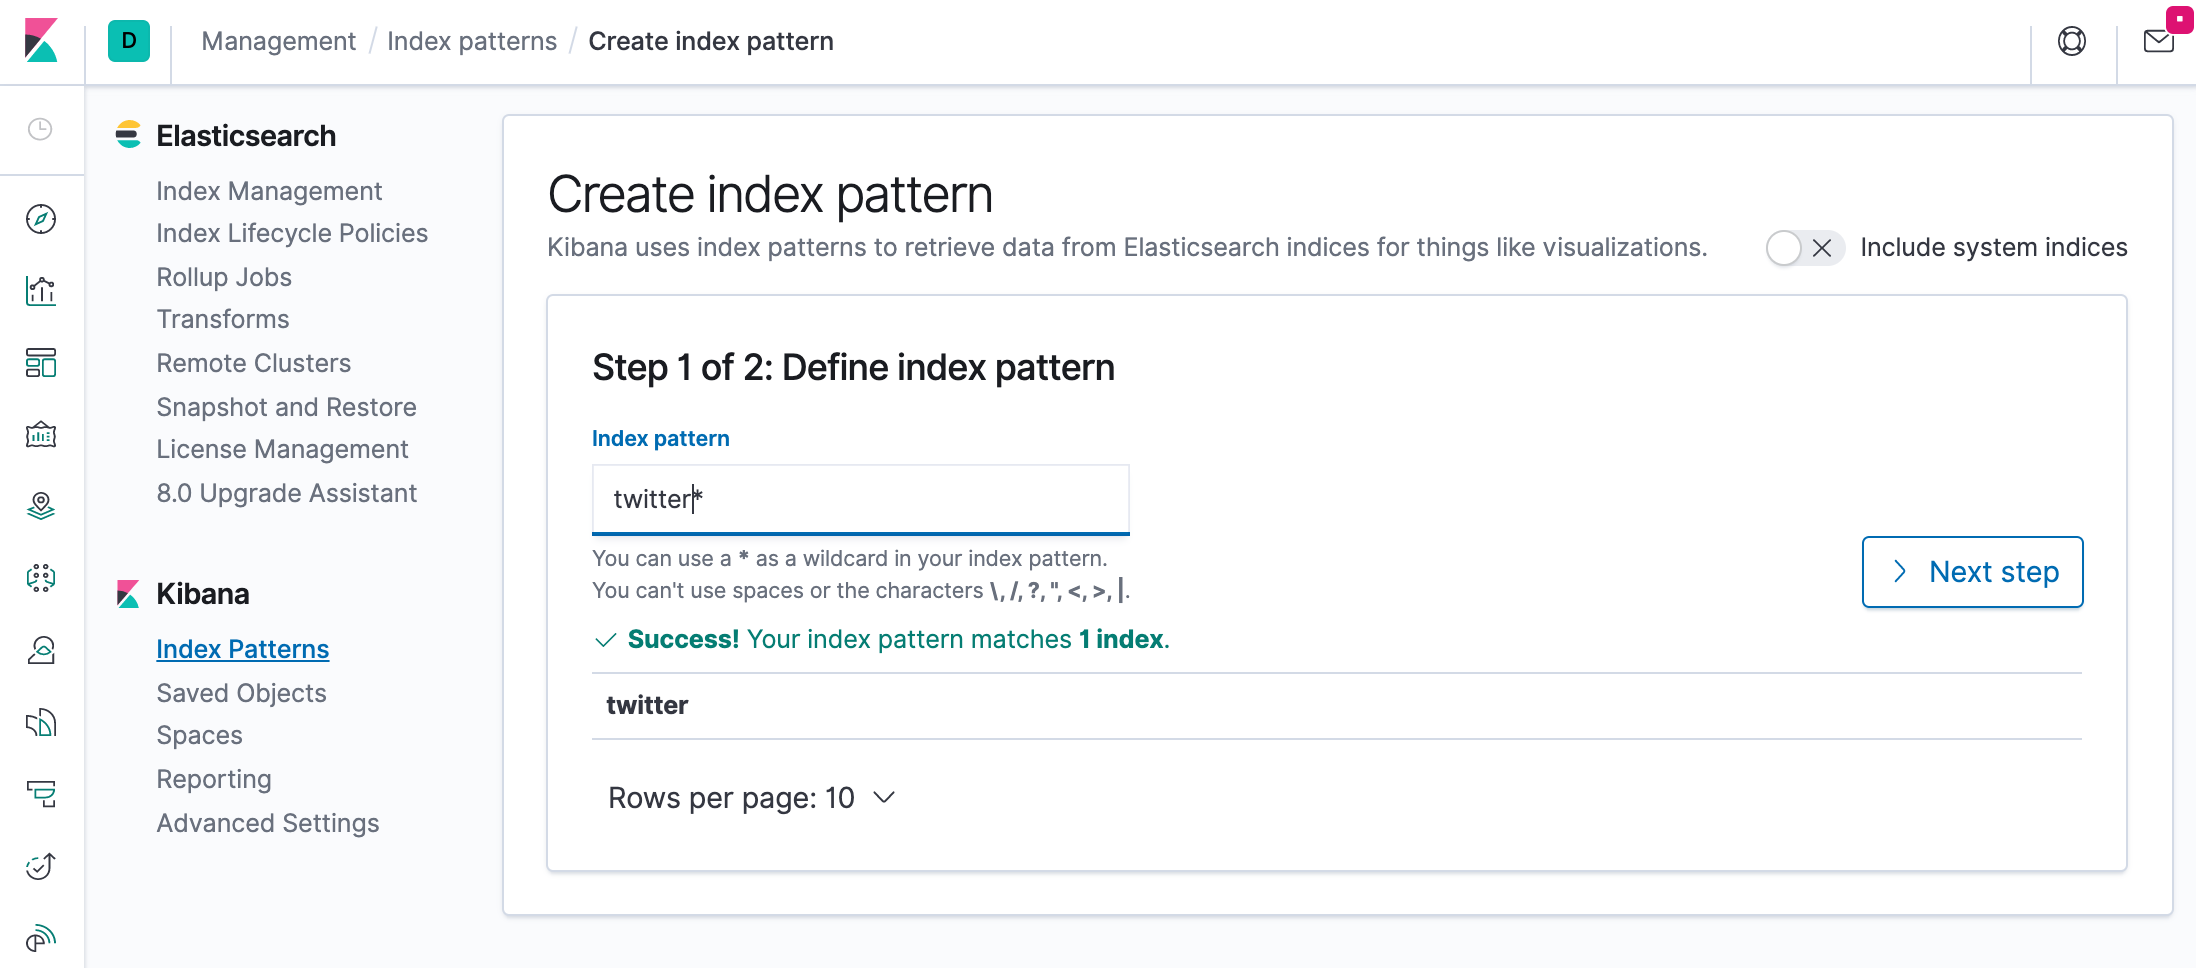
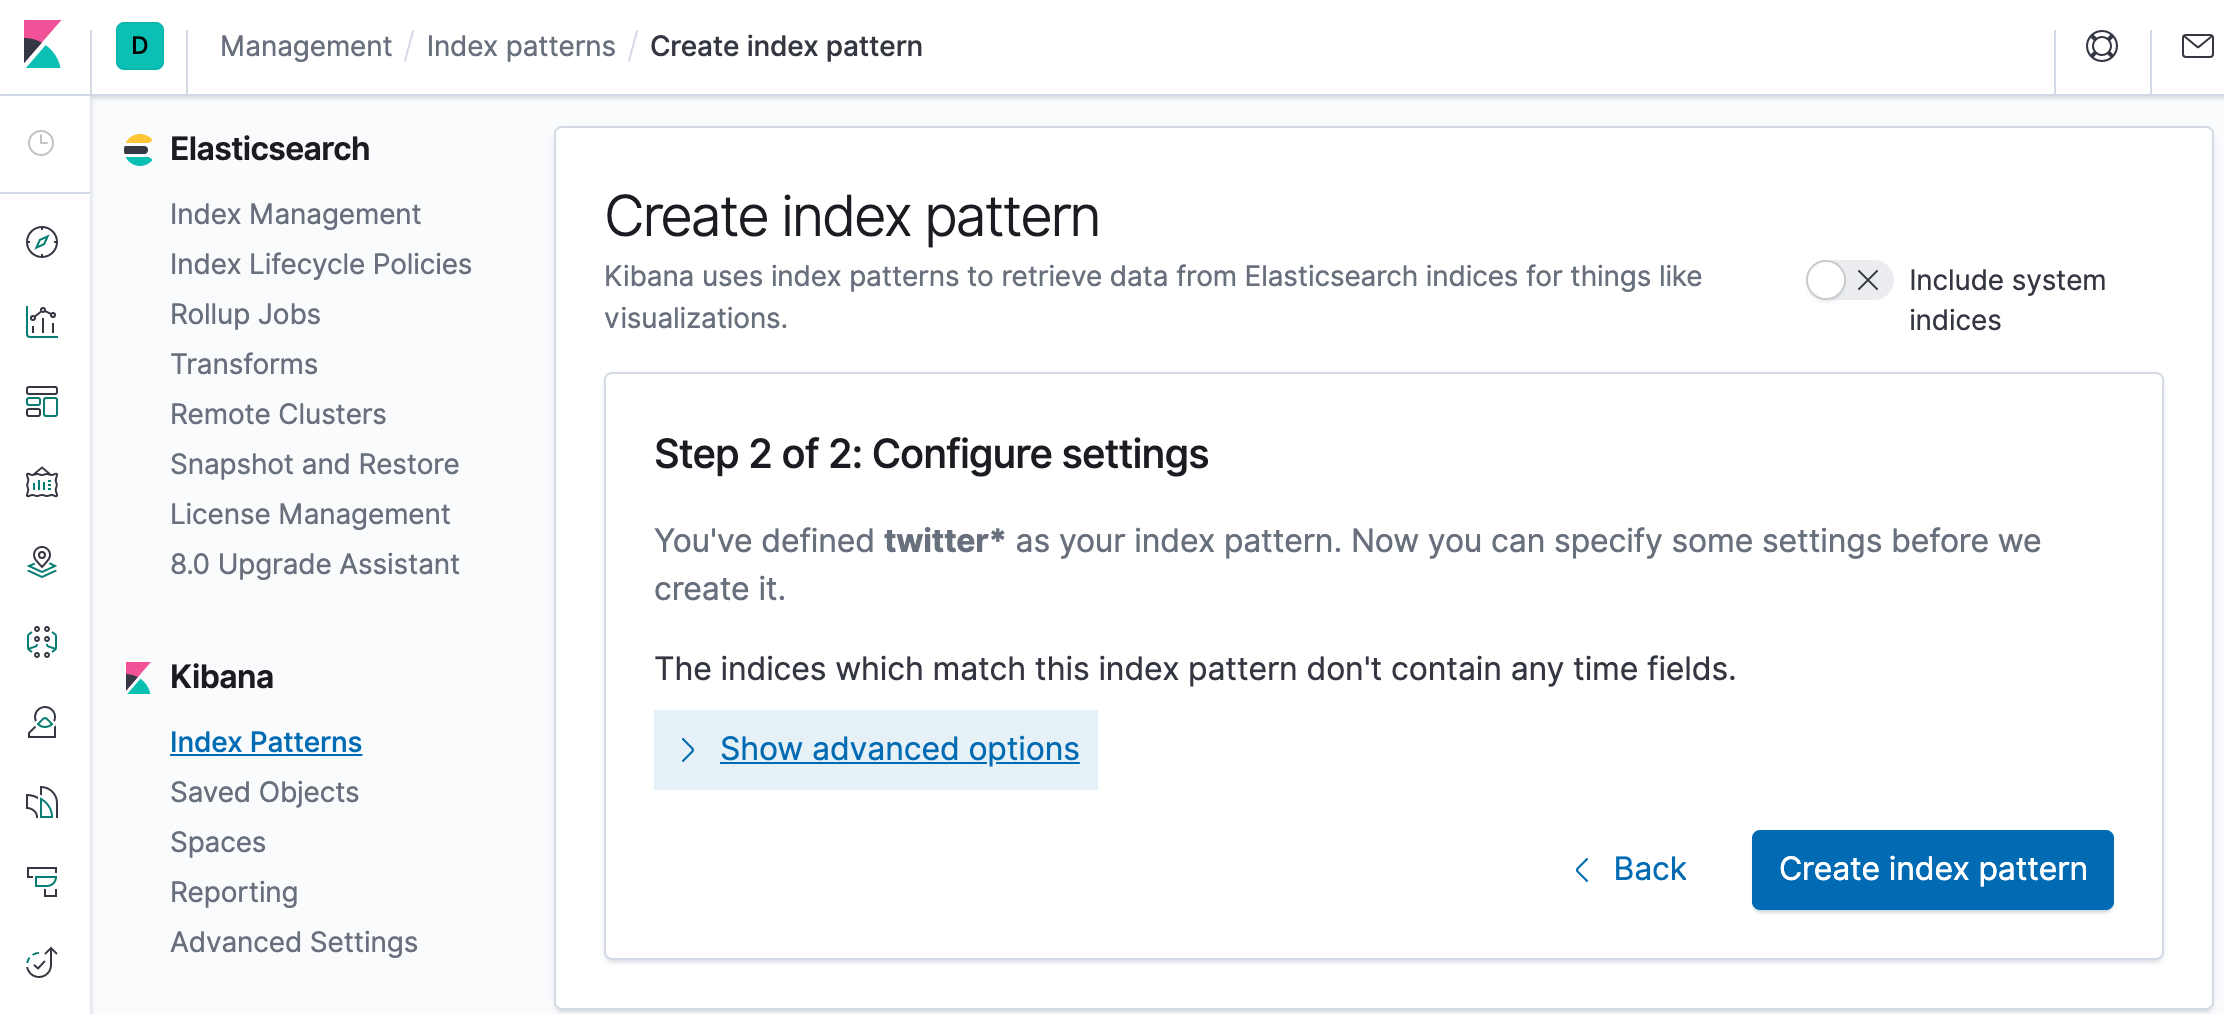
Click “Create index pattern” to add the index pattern. This first pattern is automatically configured as the default. When you have more than one index pattern, we can designate which one to use as the default by clicking on the star icon above the index pattern title from Management > Index Patterns.
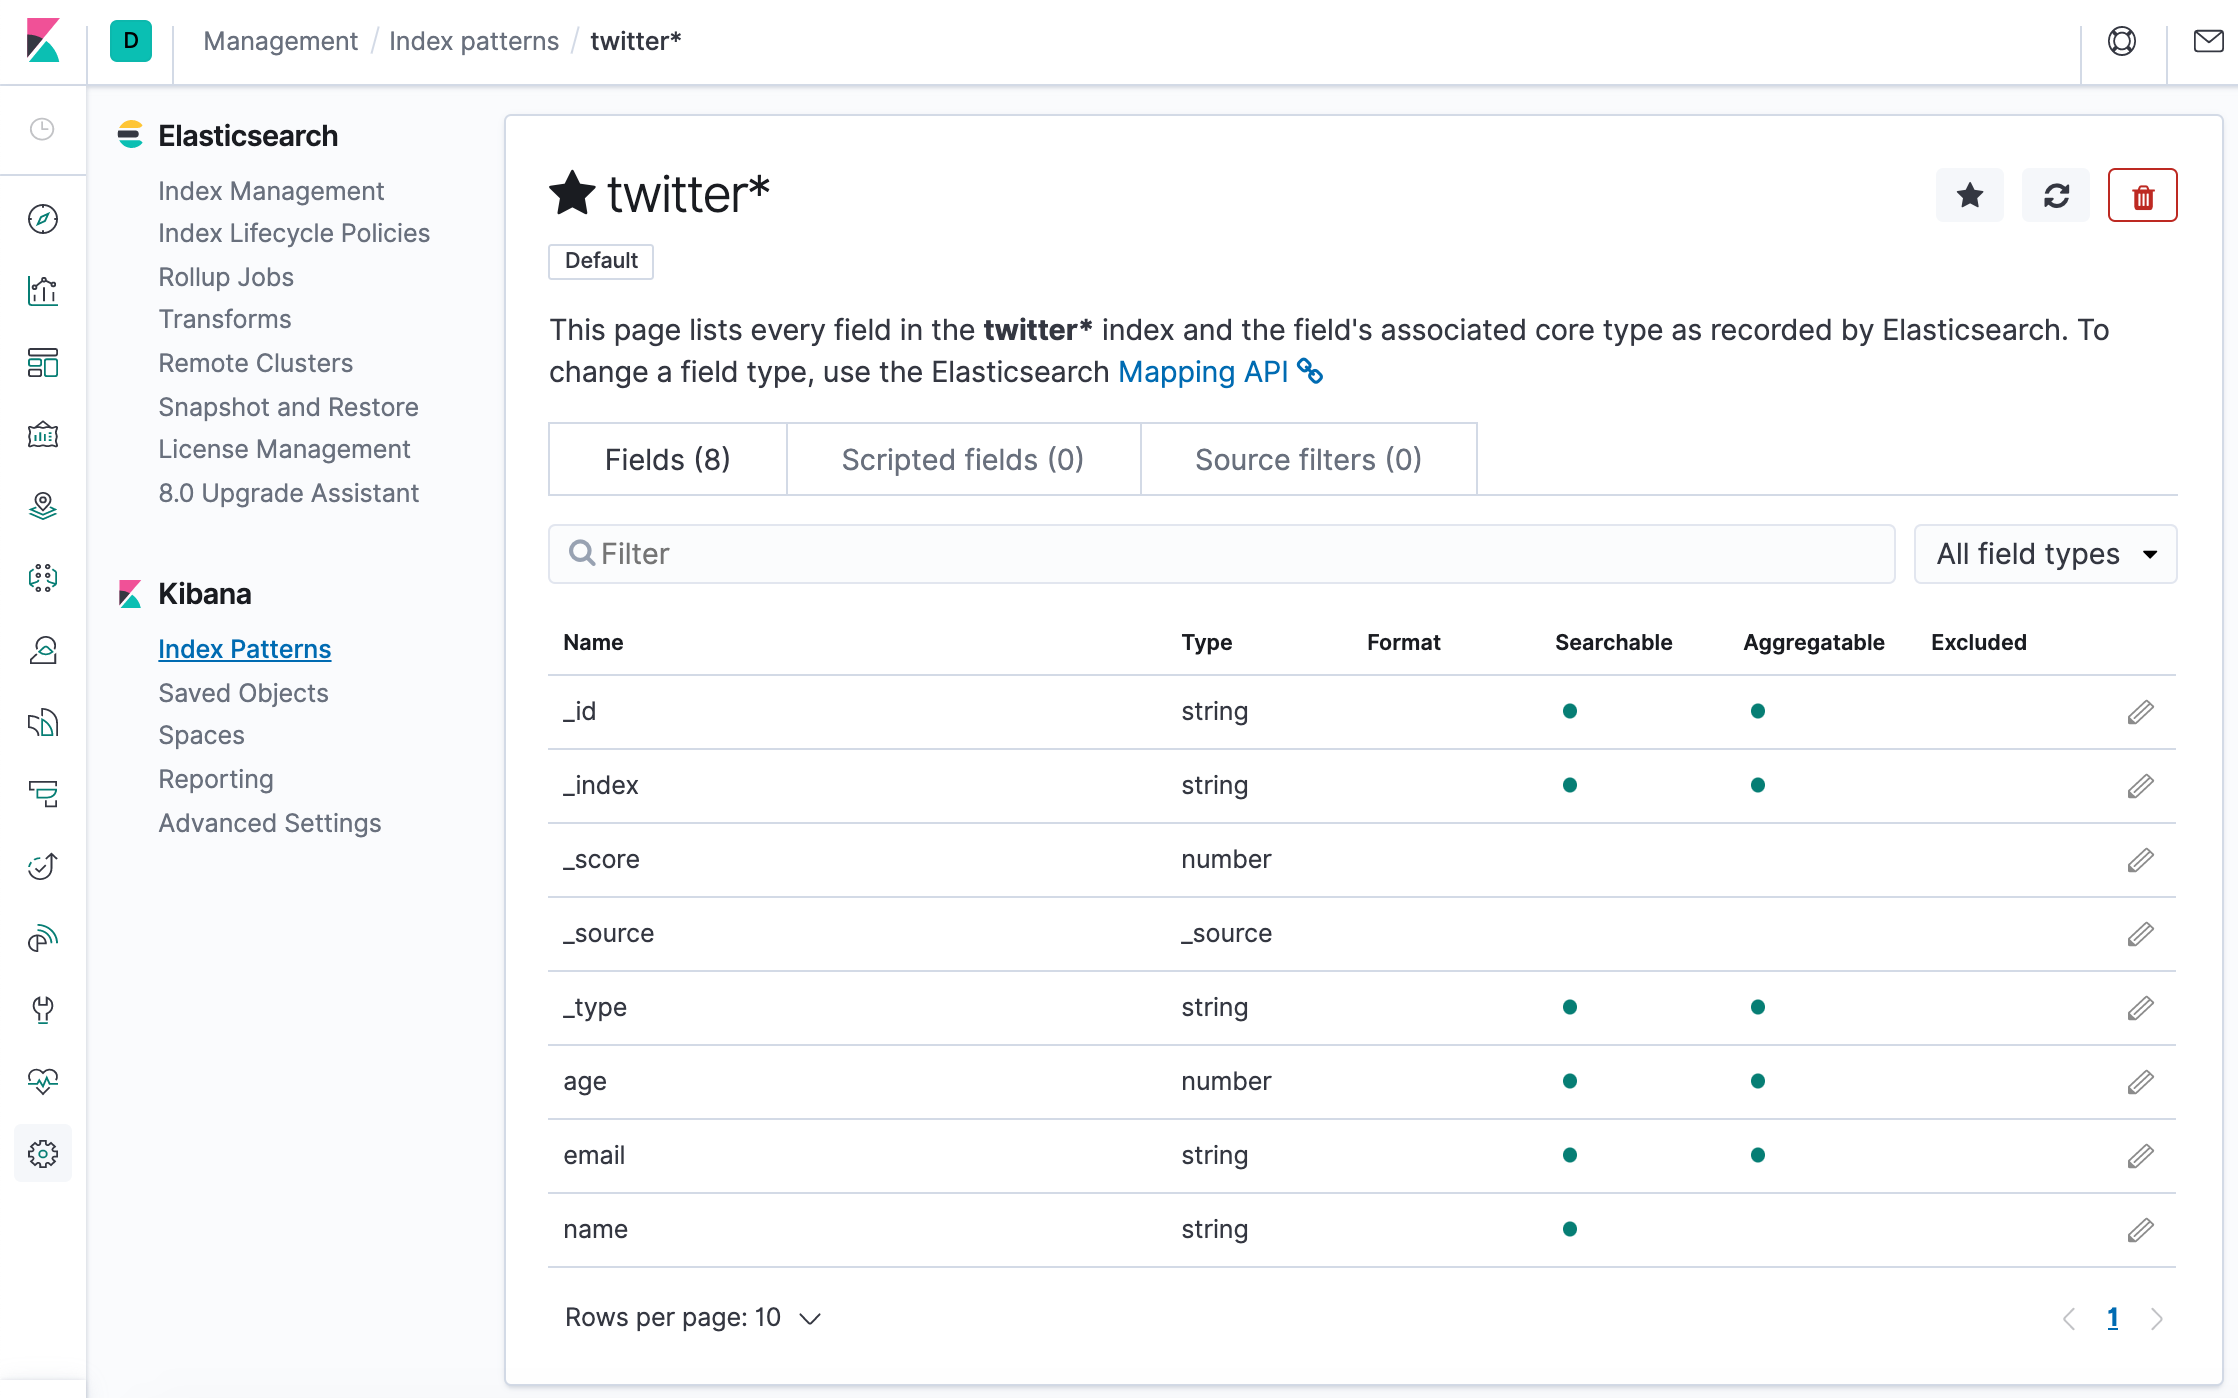
All done! Kibana is now connected to our Elasticsearch data. Kibana displays a read-only list of fields configured for the matching index.
Adding Kibana Sample Data from elastic.co
The following sections are based on https://www.elastic.co/guide/en/kibana/7.6/tutorial-sample-data.html
Now, let’s run ELK stack using ELK Stack with docker compose.
Before we do that, let’s modify the setup for xpack in “elasticsearch/config/elasticsearch.yml” to set “xpack.security.enabled: true”. Otherwise, we may the following error:
{"error":{"root_cause":[{"type":"security_exception","reason":"missing authentication credentials for REST request [/]","header":{"WWW-Authenticate":"Basic realm=\"security\" charset=\"UTF-8\""}}],"type":"security_exception","reason":"missing authentication credentials for REST request [/]","header":{"WWW-Authenticate":"Basic realm=\"security\" charset=\"UTF-8\""}},"status":401}
$ docker-compose up -d
Creating network "einsteinish-elk-stack-with-docker-compose_elk" with driver "bridge"
Creating einsteinish-elk-stack-with-docker-compose_elasticsearch_1 ... done
Creating einsteinish-elk-stack-with-docker-compose_kibana_1        ... done
Creating einsteinish-elk-stack-with-docker-compose_logstash_1      ... done

$ docker-compose ps
                          Name                                         Command               State                                        Ports
-------------------------------------------------------------------------------------------------------------------------------------------------------------------------------------
einsteinish-elk-stack-with-docker-compose_elasticsearch_1   /usr/local/bin/docker-entr ...   Up      0.0.0.0:9200->9200/tcp, 0.0.0.0:9300->9300/tcp
einsteinish-elk-stack-with-docker-compose_kibana_1          /usr/local/bin/dumb-init - ...   Up      0.0.0.0:5601->5601/tcp
einsteinish-elk-stack-with-docker-compose_logstash_1        /usr/local/bin/docker-entr ...   Up      0.0.0.0:5000->5000/tcp, 0.0.0.0:5000->5000/udp, 5044/tcp, 0.0.0.0:9600->9600/tcp
$
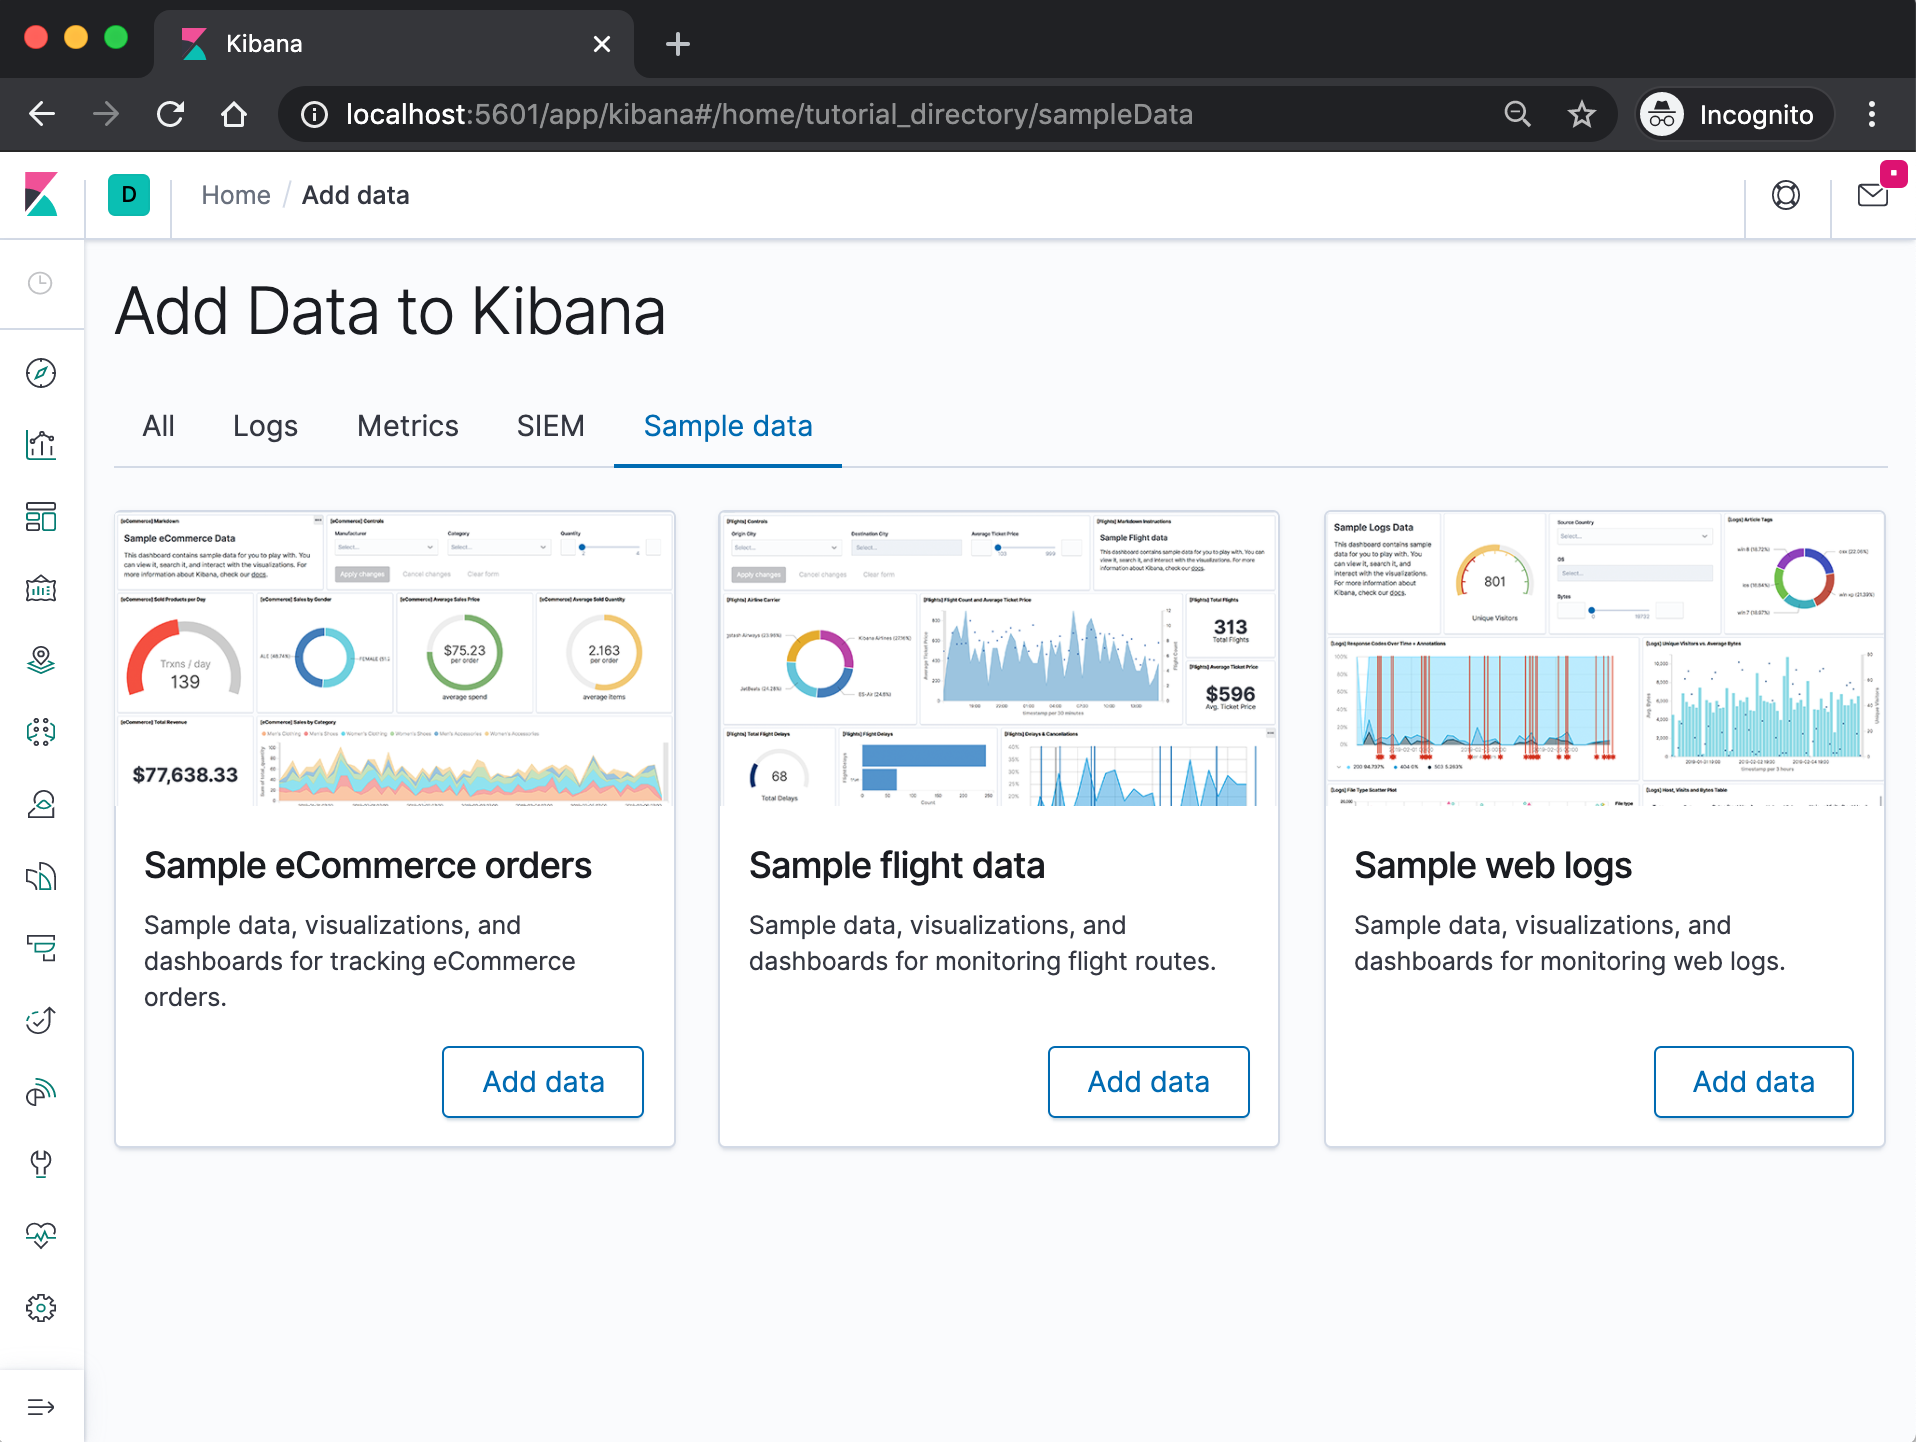
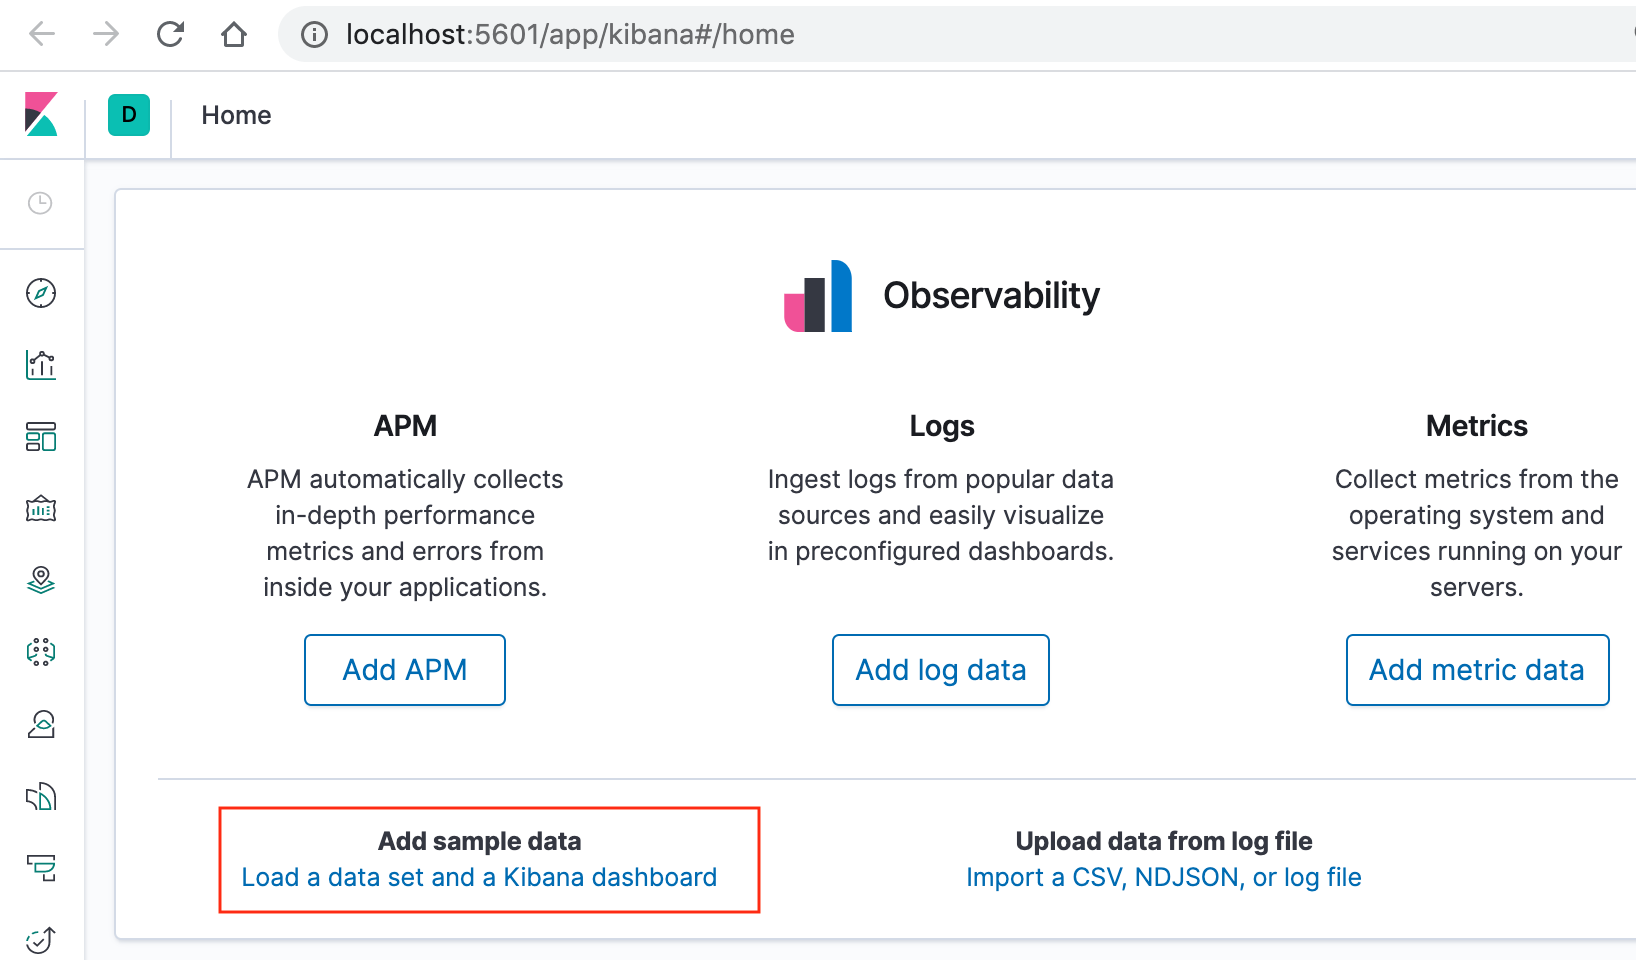
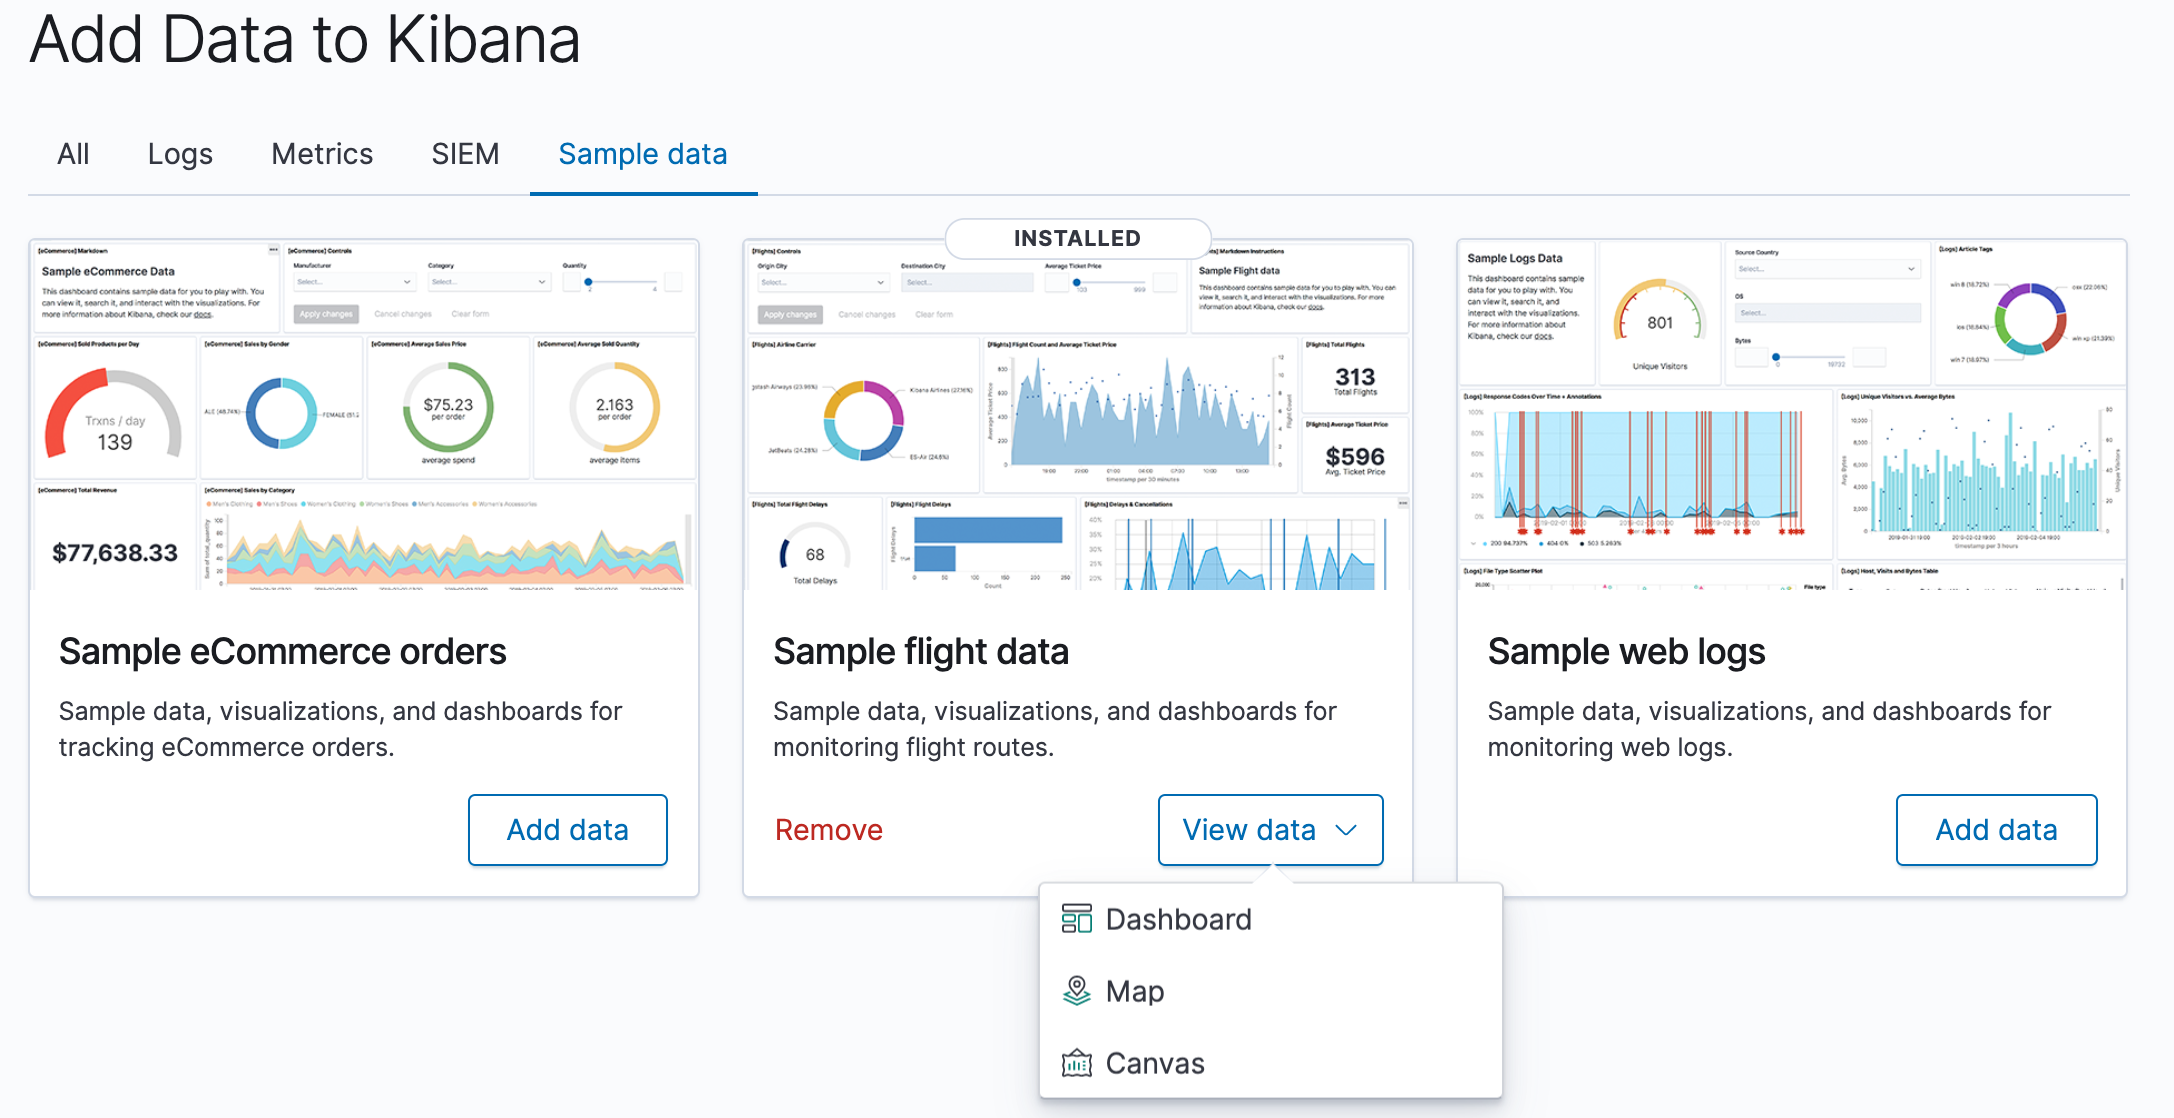
On the Kibana home page, click the link underneath Add sample data.
On the Sample flight data card, click Add data.
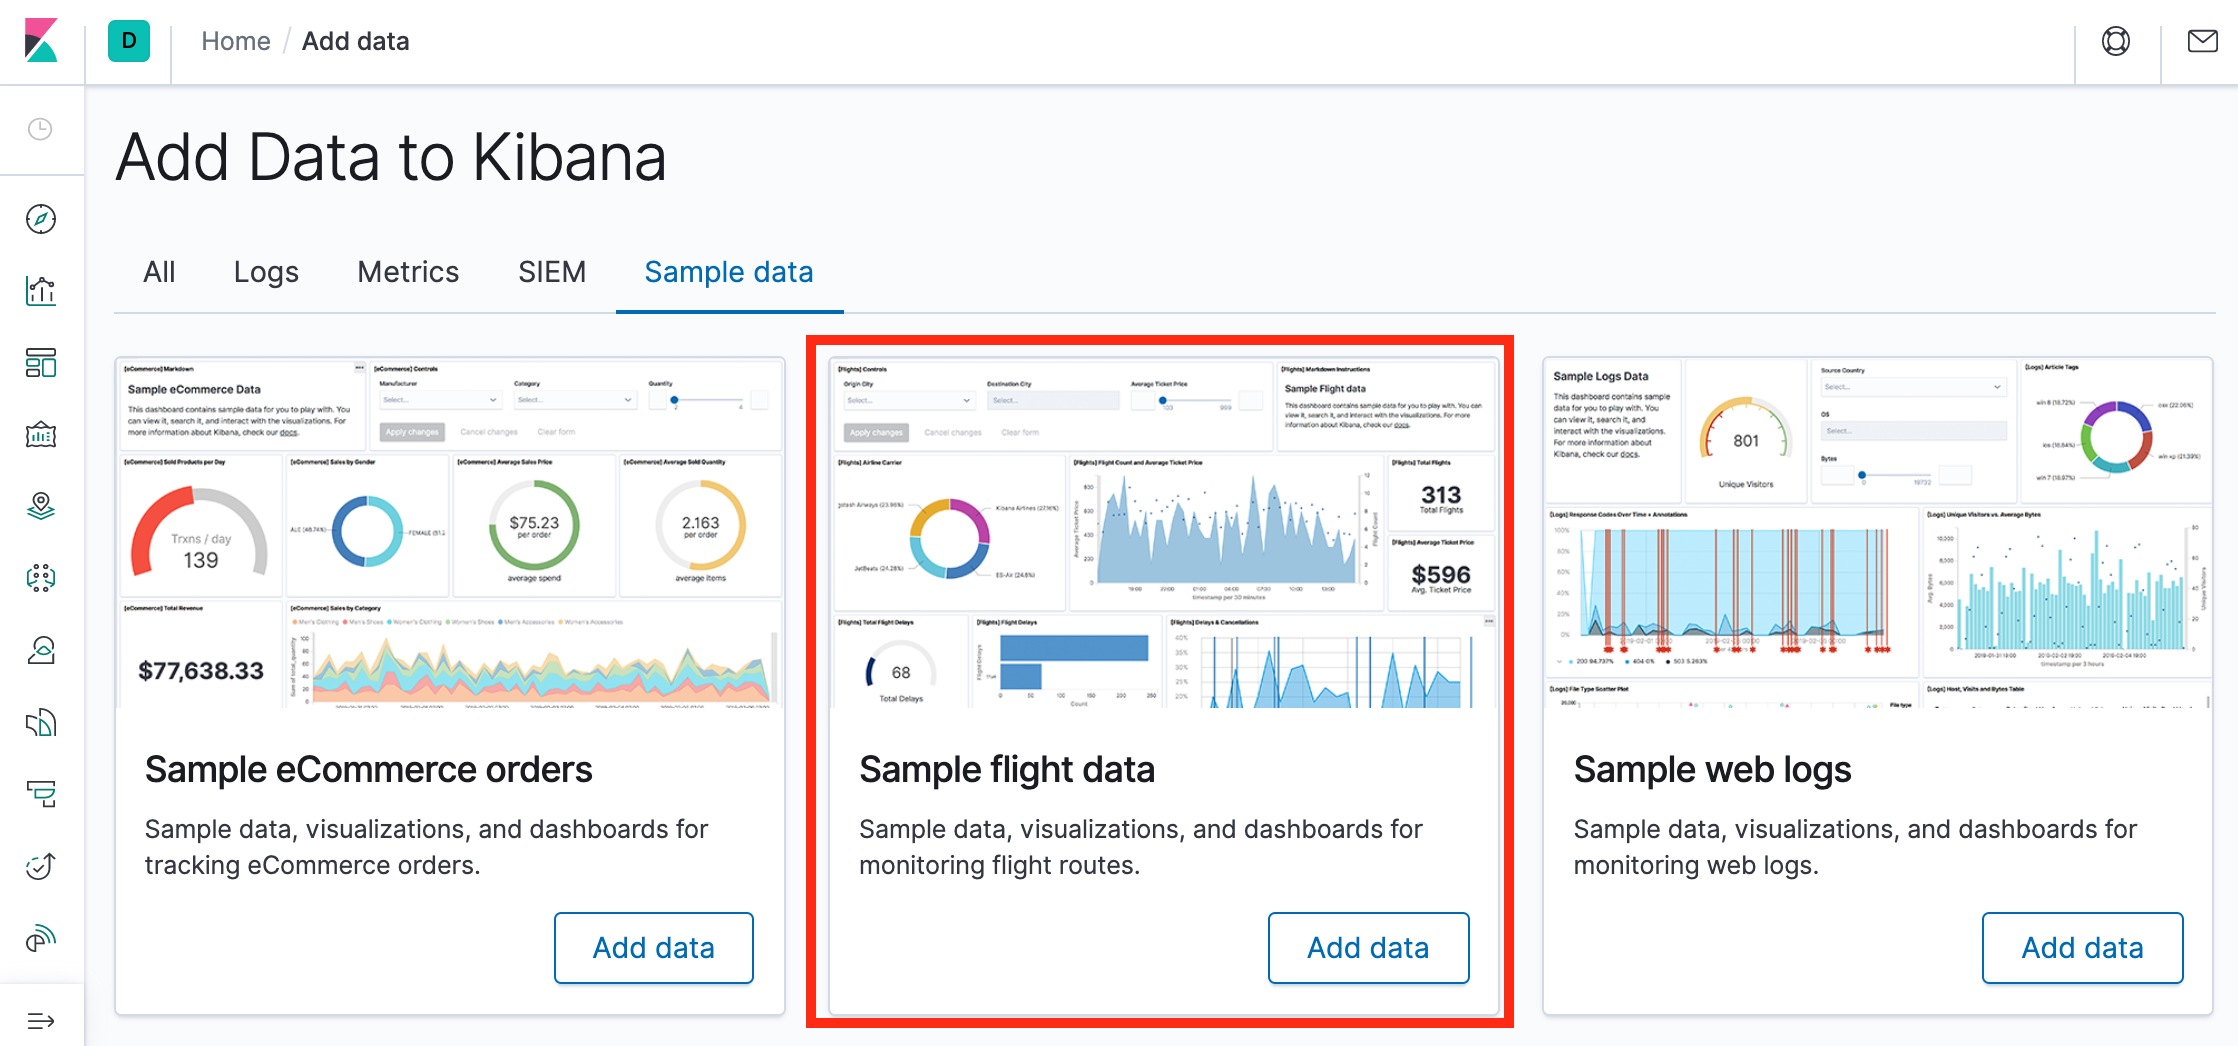
Once the data is added, click View data > Dashboard.
Now, we are on the Global Flight dashboard, a collection of charts, graphs, maps, and other visualizations of the the data in the kibana_sample_data_flights index.
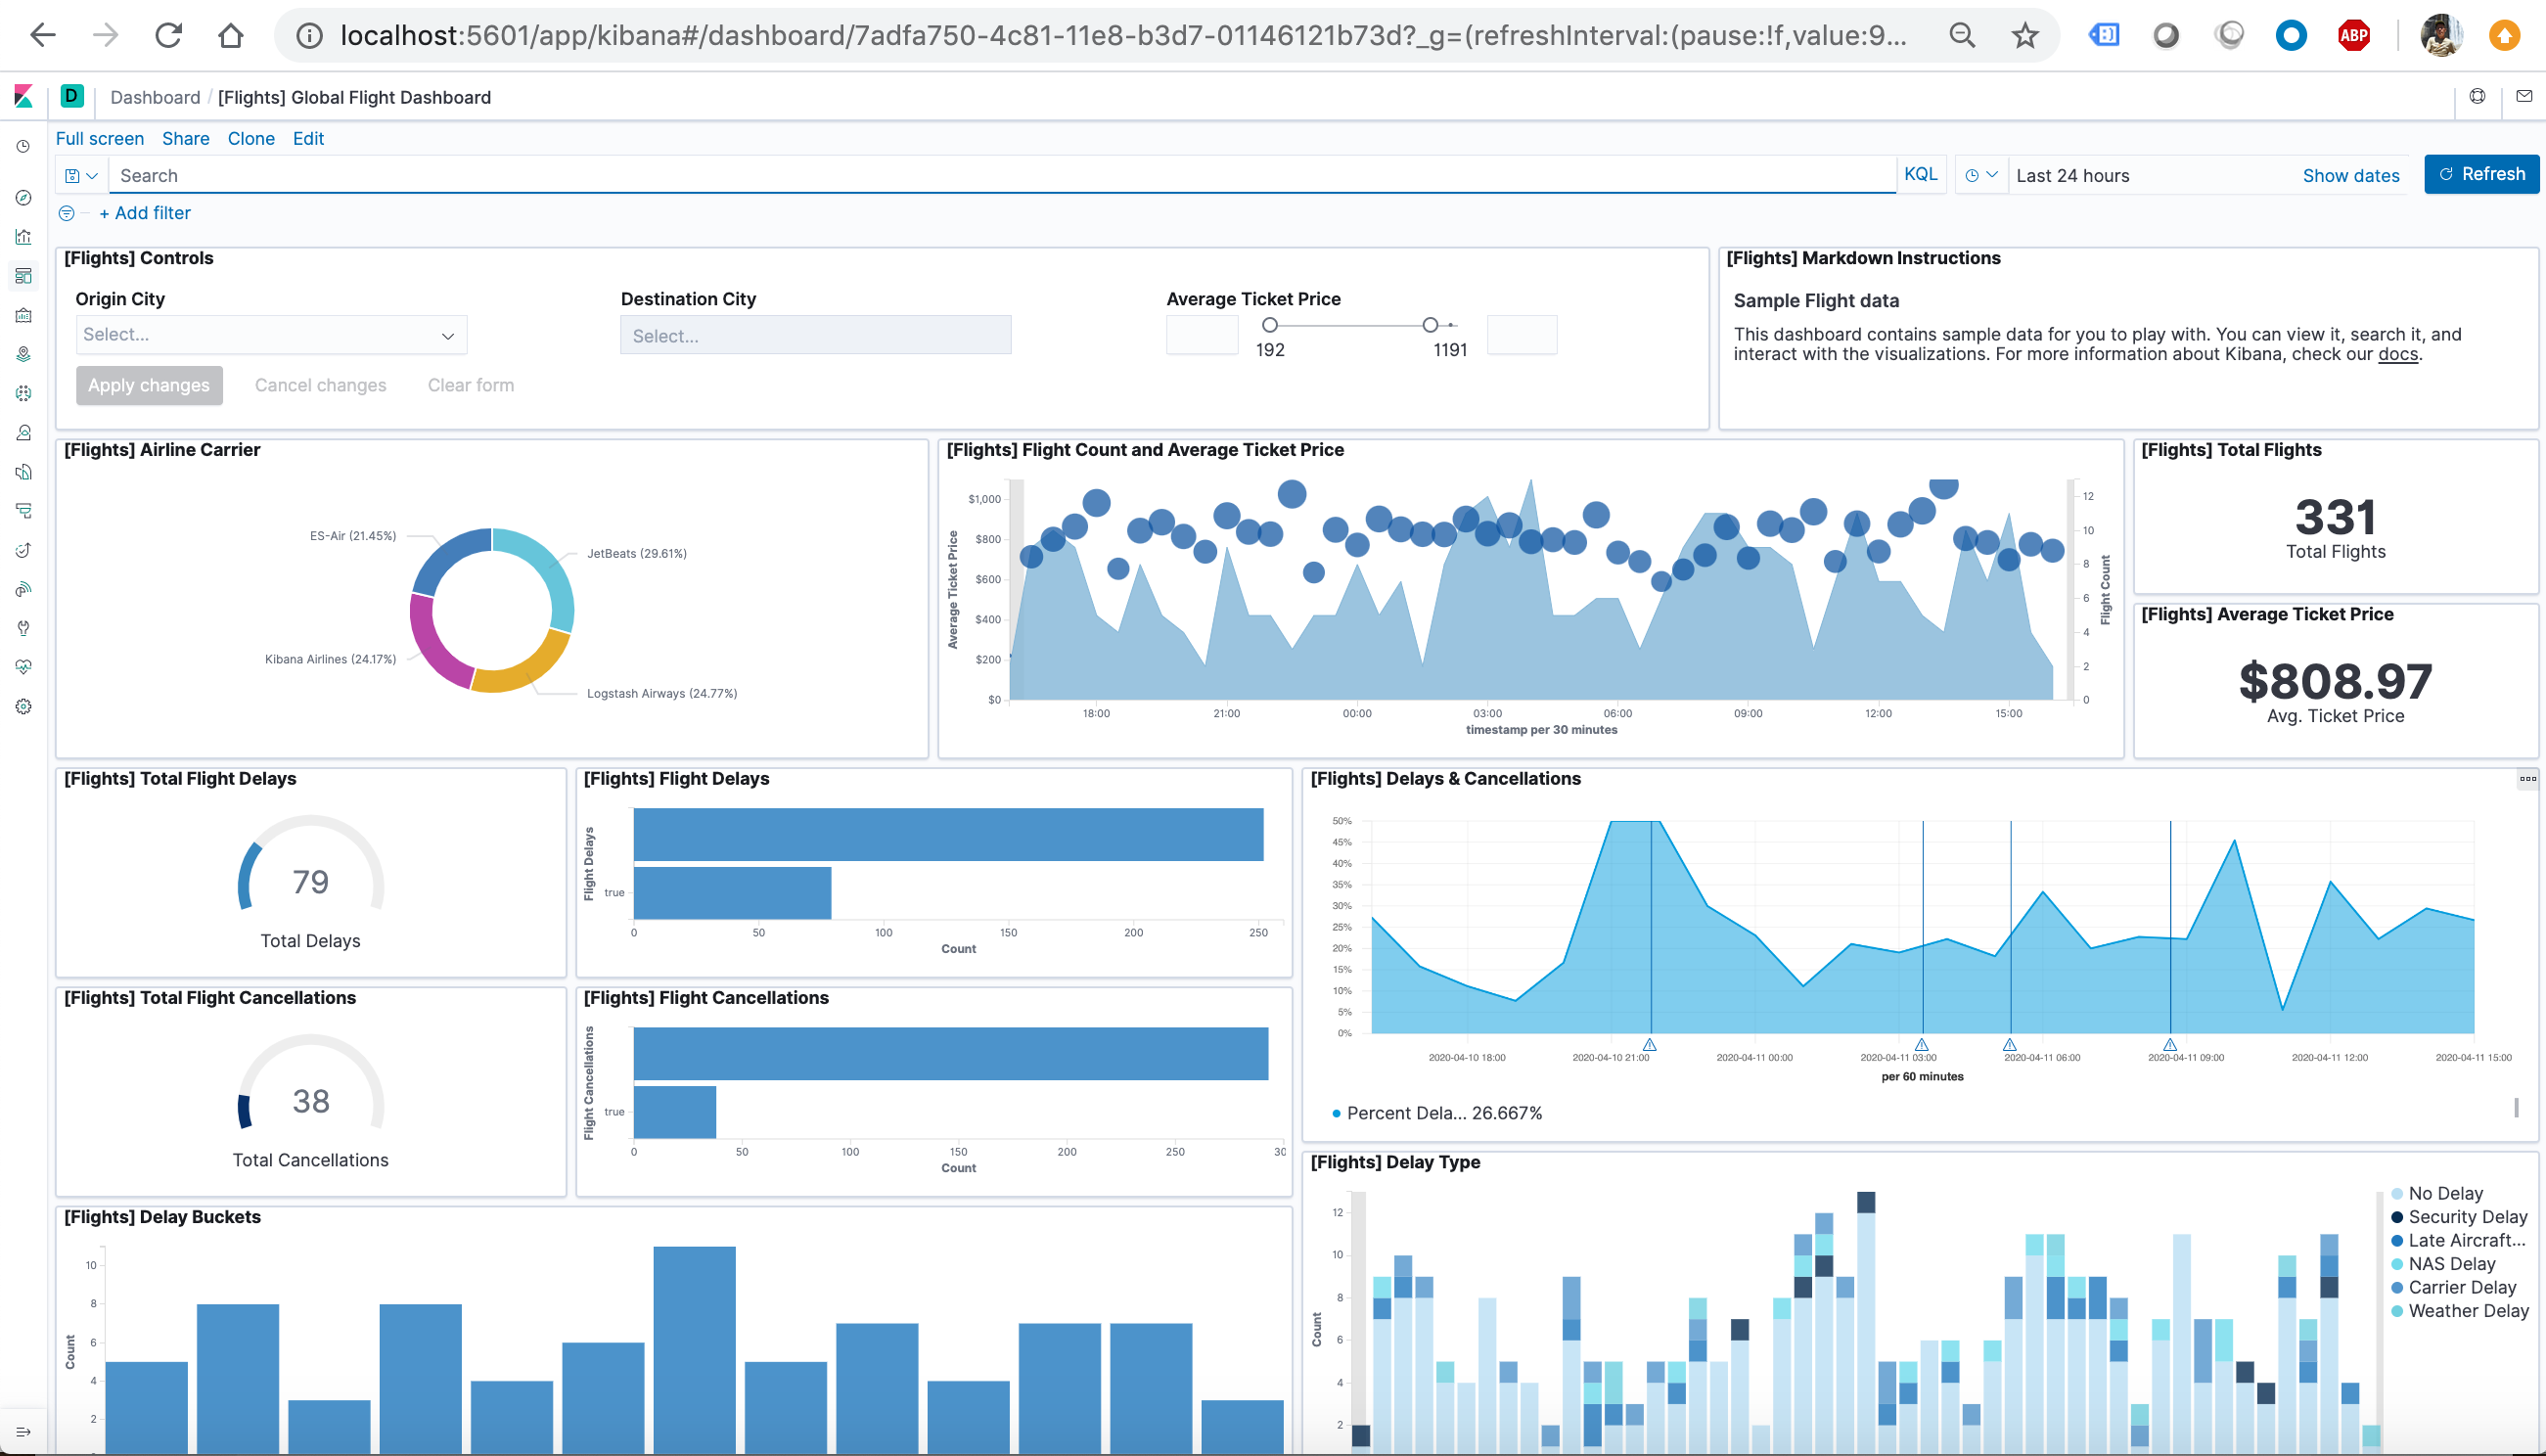
Filtering the Sample Data
- In the Controls visualization, set an Origin City and a Destination City.
- Click Apply changes. The OriginCityName and the DestCityName fields are filtered to match the data we specified. For example, this dashboard shows the data for flights from London to Oslo.
- To add a filter manually, click Add filter in the filter bar, and specify the data we want to view.
- When we are finished experimenting, remove all filters.
Querying the Data
- To find all flights out of Rome, enter this query in the query bar and click Update:OriginCityName:Rome
- For a more complex query with AND and OR, try this: OriginCityName:Rome AND (Carrier:JetBeats OR “Kibana Airlines”)
- When finished exploring the dashboard, remove the query by clearing the contents in the query bar and clicking Update.
Discovering the Data
In Discover, we have access to every document in every index that matches the selected index pattern. The index pattern tells Kibana which Elasticsearch index we are currently exploring. We can submit search queries, filter the search results, and view document data.
- In the side navigation, click Discover.
- Ensure kibana_sample_data_flights is the current index pattern. We might need to click New in the menu bar to refresh the data.
- To choose which fields to display, hover the pointer over the list of Available fields, and then click add next to each field we want include as a column in the table. For example, if we add the DestAirportID and DestWeather fields, the display includes columns for those two fields.
Editing Visualization
We have edit permissions for the Global Flight dashboard, so we can change the appearance and behavior of the visualizations. For example, we might want to see which airline has the lowest average fares.
- In the side navigation, click Recently viewed and open the Global Flight Dashboard.
- In the menu bar, click Edit.
- In the Average Ticket Price visualization, click the gear icon in the upper right.
- From the Options menu, select Edit visualization.
Create a bucket aggregation
- In the Buckets pane, select Add > Split group.
- In the Aggregation dropdown, select Terms.
- In the Field dropdown, select Carrier.
- Set Descending to 4.
- Click Apply changes apply changes button.
Save the Visualization
- In the menu bar, click Save.
- Leave the visualization name as is and confirm the save.
- Go to the Global Flight dashboard and scroll the Average Ticket Price visualization to see the four prices.
- Optionally, edit the dashboard. Resize the panel for the Average Ticket Price visualization by dragging the handle in the lower right. We can also rearrange the visualizations by clicking the header and dragging. Be sure to save the dashboard.
Inspect the data
Seeing visualizations of our data is great, but sometimes we need to look at the actual data to understand what’s really going on. We can inspect the data behind any visualization and view the Elasticsearch query used to retrieve it.
- In the dashboard, hover the pointer over the pie chart, and then click the icon in the upper right.
- From the Options menu, select Inspect. The initial view shows the document count.
- To look at the query used to fetch the data for the visualization, select View > Requests in the upper right of the Inspect pane.
Remove the sample data set
When we’re done experimenting with the sample data set, we can remove it.
- Go to the Sample data page.
- On the Sample flight data card, click Remove.
Note: Continues to Docker – ELK 7.6 : Kibana on Centos 7 Part 2.
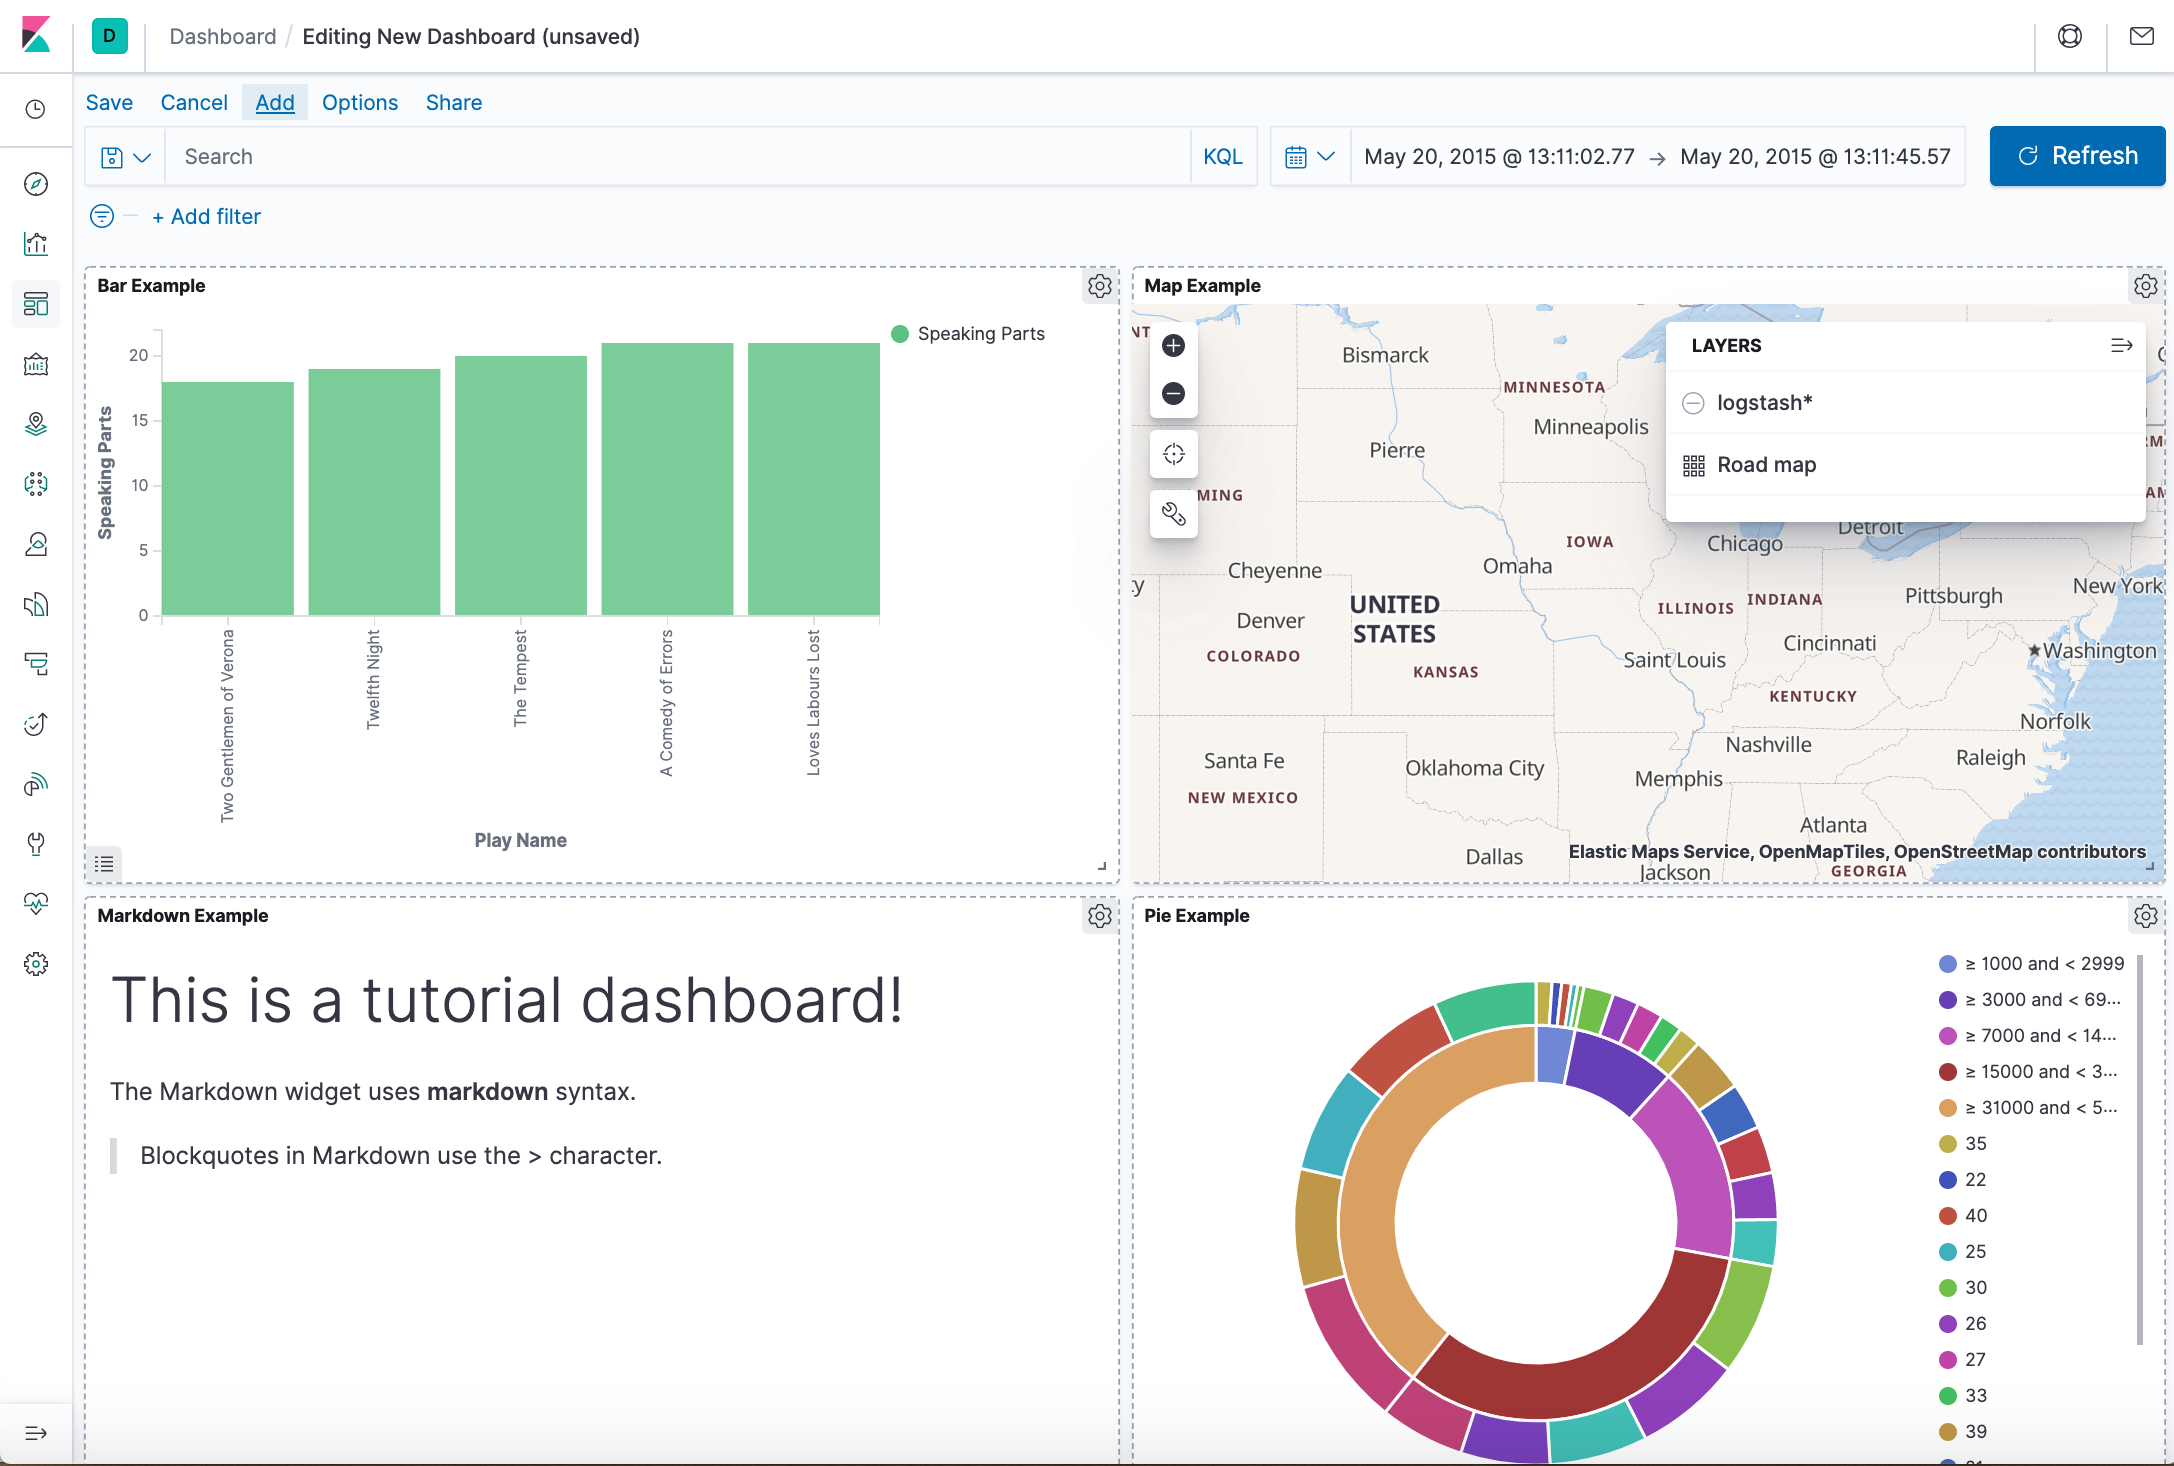
In the tutorial, we’ll build our own dashboard composed of 4 visualization panels as the following: