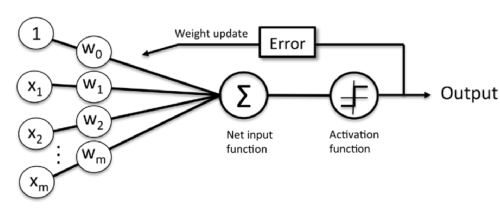
In this tutorial, we won’t use scikit. Instead we’ll approach classification via historical Perceptron learning algorithm based on “Python Machine Learning by Sebastian Raschka, 2015”.
We’ll extract two features of two flowers form Iris data sets. Then, we’ll updates weights using the difference between predicted and target values.
Although the Perceptron classified the two Iris flower classes perfectly, convergence is one of the biggest problems of the perceptron.
Code : Perceptron learning algorithm
The following code defines perceptron interface as a Python Class:
# perceptron.py
import numpy as np

class Perceptron(object):
   def __init__(self, rate = 0.01, niter = 10):
      self.rate = rate
      self.niter = niter

   def fit(self, X, y):
      """Fit training data
      X : Training vectors, X.shape : [#samples, #features]
      y : Target values, y.shape : [#samples]
      """

      # weights
      self.weight = np.zeros(1 + X.shape[1])

      # Number of misclassifications
      self.errors = []  # Number of misclassifications

      for i in range(self.niter):
         err = 0
         for xi, target in zip(X, y):
            delta_w = self.rate * (target - self.predict(xi))
            self.weight[1:] += delta_w * xi
            self.weight[0] += delta_w
            err += int(delta_w != 0.0)
         self.errors.append(err)
      return self

   def net_input(self, X):
      """Calculate net input"""
      return np.dot(X, self.weight[1:]) + self.weight[0]

   def predict(self, X):
      """Return class label after unit step"""
      return np.where(self.net_input(X) >= 0.0, 1, -1)
bogotobogo.com site search:
Preprocessing Iris data set
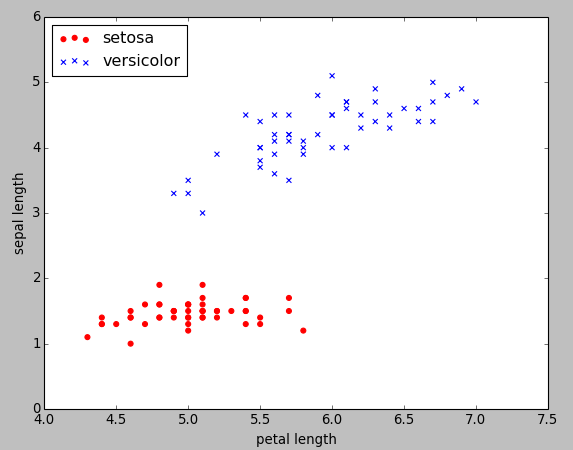
To test our perceptron implementation, we will load the two flower classes Setosa and Versicolor from the Iris data set. The perceptron rule is not restricted to two dimensions, however, we will only consider the two features sepal length and petal length for visualization purposes.
Now, we will use the pandas library to load the Iris data set into a DataFrame object:
>>> import pandas as pd
>>> df = pd.read_csv('https://archive.ics.uci.edu/ml/machine-learning-databases/iris/iris.data', header=None)
>>>
>>> df.tail()
       0    1    2    3               4
145  6.7  3.0  5.2  2.3  Iris-virginica
146  6.3  2.5  5.0  1.9  Iris-virginica
147  6.5  3.0  5.2  2.0  Iris-virginica
148  6.2  3.4  5.4  2.3  Iris-virginica
149  5.9  3.0  5.1  1.8  Iris-virginica
>>>
>>> df.iloc[145:150, 0:5]
       0    1    2    3               4
145  6.7  3.0  5.2  2.3  Iris-virginica
146  6.3  2.5  5.0  1.9  Iris-virginica
147  6.5  3.0  5.2  2.0  Iris-virginica
148  6.2  3.4  5.4  2.3  Iris-virginica
149  5.9  3.0  5.1  1.8  Iris-virginica
Next, we extract the first 100 class labels that correspond to the 50 Iris-Setosa and 50 Iris-Versicolor flowers, respectively:
>>> import matplotlib.pyplot as plt
>>> import numpy as np
>>>
>>> y = df.iloc[0:100, 4].values
>>> y
array(['Iris-setosa', 'Iris-setosa', 'Iris-setosa', 'Iris-setosa',
       'Iris-setosa', 'Iris-setosa', 'Iris-setosa', 'Iris-setosa',
       'Iris-setosa', 'Iris-setosa', 'Iris-setosa', 'Iris-setosa',
       'Iris-setosa', 'Iris-setosa', 'Iris-setosa', 'Iris-setosa',
       'Iris-setosa', 'Iris-setosa', 'Iris-setosa', 'Iris-setosa',
       'Iris-setosa', 'Iris-setosa', 'Iris-setosa', 'Iris-setosa',
       'Iris-setosa', 'Iris-setosa', 'Iris-setosa', 'Iris-setosa',
       'Iris-setosa', 'Iris-setosa', 'Iris-setosa', 'Iris-setosa',
       'Iris-setosa', 'Iris-setosa', 'Iris-setosa', 'Iris-setosa',
       'Iris-setosa', 'Iris-setosa', 'Iris-setosa', 'Iris-setosa',
       'Iris-setosa', 'Iris-setosa', 'Iris-setosa', 'Iris-setosa',
       'Iris-setosa', 'Iris-setosa', 'Iris-setosa', 'Iris-setosa',
       'Iris-setosa', 'Iris-setosa', 'Iris-versicolor', 'Iris-versicolor',
       'Iris-versicolor', 'Iris-versicolor', 'Iris-versicolor',
       'Iris-versicolor', 'Iris-versicolor', 'Iris-versicolor',
       'Iris-versicolor', 'Iris-versicolor', 'Iris-versicolor',
       'Iris-versicolor', 'Iris-versicolor', 'Iris-versicolor',
       'Iris-versicolor', 'Iris-versicolor', 'Iris-versicolor',
       'Iris-versicolor', 'Iris-versicolor', 'Iris-versicolor',
       'Iris-versicolor', 'Iris-versicolor', 'Iris-versicolor',
       'Iris-versicolor', 'Iris-versicolor', 'Iris-versicolor',
       'Iris-versicolor', 'Iris-versicolor', 'Iris-versicolor',
       'Iris-versicolor', 'Iris-versicolor', 'Iris-versicolor',
       'Iris-versicolor', 'Iris-versicolor', 'Iris-versicolor',
       'Iris-versicolor', 'Iris-versicolor', 'Iris-versicolor',
       'Iris-versicolor', 'Iris-versicolor', 'Iris-versicolor',
       'Iris-versicolor', 'Iris-versicolor', 'Iris-versicolor',
       'Iris-versicolor', 'Iris-versicolor', 'Iris-versicolor',
       'Iris-versicolor', 'Iris-versicolor', 'Iris-versicolor'], dtype=object)
>>>
The we want to convert the class labels into the two integer class labels 1 (Versicolor) and -1 (Setosa) that we assign to a vector y where the values method of a pandas DataFrame yields the corresponding NumPy representation.
>>> y = np.where(y == 'Iris-setosa', -1, 1)
>>> y
array([-1, -1, -1, -1, -1, -1, -1, -1, -1, -1, -1, -1, -1, -1, -1, -1, -1,
       -1, -1, -1, -1, -1, -1, -1, -1, -1, -1, -1, -1, -1, -1, -1, -1, -1,
       -1, -1, -1, -1, -1, -1, -1, -1, -1, -1, -1, -1, -1, -1, -1, -1,  1,
        1,  1,  1,  1,  1,  1,  1,  1,  1,  1,  1,  1,  1,  1,  1,  1,  1,
        1,  1,  1,  1,  1,  1,  1,  1,  1,  1,  1,  1,  1,  1,  1,  1,  1,
        1,  1,  1,  1,  1,  1,  1,  1,  1,  1,  1,  1,  1,  1,  1])
Also, we need to extract the first feature column (sepal length) and the third feature column (petal length) of those 100 training samples and assign them to a feature matrix X:
>>> X = df.iloc[0:100, [0, 2]].values
>>> X
array([[ 5.1,  1.4],
       [ 4.9,  1.4],
           ...
       [ 5.1,  3. ],
       [ 5.7,  4.1]])
>>>
We can visualize via a two-dimensional scatter plot using the matplotlib:
>>> plt.scatter(X[:50, 0], X[:50, 1], color='red', marker='o', label='setosa')
>>> plt.scatter(X[50:100, 0], X[50:100, 1], color='blue', marker='x', label='versicolor')
>>> plt.xlabel('petal length')
>>> plt.ylabel('sepal length')
>>> plt.legend(loc='upper left')
>>> plt.show()

Training the perceptron model

Picture from “Python Machine Learning by Sebastian Raschka, 2015”
Now we can train our perceptron algorithm on the Iris data subset that we extracted in the previous section.
We will plot the misclassification error for each epoch to check if the algorithm converged and found a decision boundary that separates the two Iris flower classes:
>>> # import Perceptron from perceptron.py
>>> from perceptron import Perceptron
>>> pn = Perceptron(0.1, 10)
>>> pn.fit(X, y)
>>> plt.plot(range(1, len(pn.errors) + 1), pn.errors, marker='o')
>>> plt.xlabel('Epochs')
>>> plt.ylabel('Number of misclassifications')
>>> plt.show()
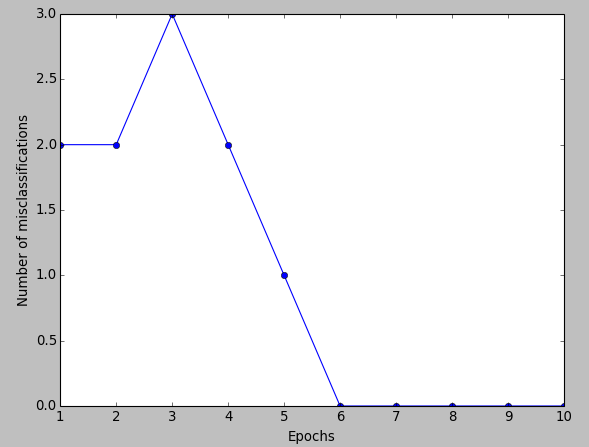
We can see the plot of the misclassification errors versus the number of epochs as shown below:

Our perceptron converged after the sixth epoch (iteration). Now we’re able to classify the training samples perfectly.
Visualize the decision boundaries
To visualize the decision boundaries for our 2D datasets, let’s implement a small convenience function:
from matplotlib.colors import ListedColormap
def plot_decision_regions(X, y, classifier, resolution=0.02):
   # setup marker generator and color map
   markers = ('s', 'x', 'o', '^', 'v')
   colors = ('red', 'blue', 'lightgreen', 'gray', 'cyan')
   cmap = ListedColormap(colors[:len(np.unique(y))])

   # plot the decision surface
   x1_min, x1_max = X[:,  0].min() - 1, X[:, 0].max() + 1
   x2_min, x2_max = X[:, 1].min() - 1, X[:, 1].max() + 1
   xx1, xx2 = np.meshgrid(np.arange(x1_min, x1_max, resolution),
   np.arange(x2_min, x2_max, resolution))
   Z = classifier.predict(np.array([xx1.ravel(), xx2.ravel()]).T)
   Z = Z.reshape(xx1.shape)
   plt.contourf(xx1, xx2, Z, alpha=0.4, cmap=cmap)
   plt.xlim(xx1.min(), xx1.max())
   plt.ylim(xx2.min(), xx2.max())

   # plot class samples
   for idx, cl in enumerate(np.unique(y)):
      plt.scatter(x=X[y == cl, 0], y=X[y == cl, 1],
      alpha=0.8, c=cmap(idx),
      marker=markers[idx], label=cl)
In the code above, we define a number of colors and markers and create a color map from the list of colors via ListedColormap.
Then, we determine the minimum and maximum values for the two features and use those feature vectors to create a pair of grid arrays xx1 and xx2 via the NumPy meshgrid function.
Since we trained our perceptron classifier on two feature dimensions, we need to flatten the grid arrays and create a matrix that has the same number of columns as the Iris training subset so that we can use the predict method to predict the class labels Z of the corresponding grid points.
After reshaping the predicted class labels Z into a grid with the same dimensions as xx1 and xx2 , we can now draw a contour plot via matplotlib’s contourf function that maps the different decision regions to different colors for each predicted class in the grid array:
>>> plot_decision_regions(X, y, classifier=pn)
>>> plt.xlabel('sepal length [cm]')
>>> plt.ylabel('petal length [cm]')
>>> plt.legend(loc='upper left')
>>> plt.show()
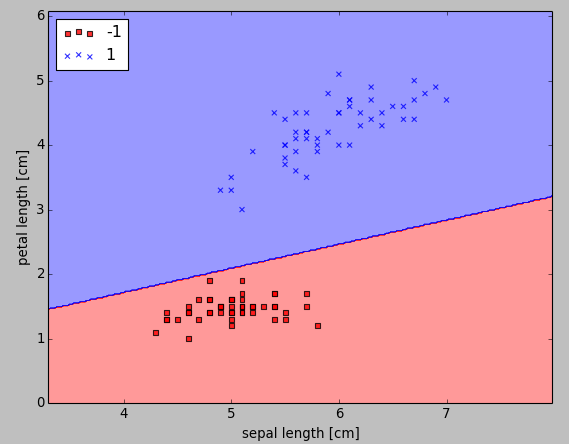
As shown in the following figure, we can now see a plot of the decision regions.

The perceptron learned a decision boundary that was able to classify all flower samples in the Iris training subset perfectly.
Although the perceptron classified the two Iris flower classes perfectly, convergence is one of the biggest problems of the perceptron.
Frank Rosenblatt proved mathematically that the perceptron learning rule converges if the two classes can be separated by a linear hyperplane.
However, if classes cannot be separated perfectly by such a linear decision boundary, the weights will never stop updating unless we set a maximum number of epochs.
From “Python Machine Learning by Sebastian Raschka, 2015”.
